Sensitivity Analysis:
A Practical Guide to Testing Assumptions, Understanding Risk and Making Better Decisions
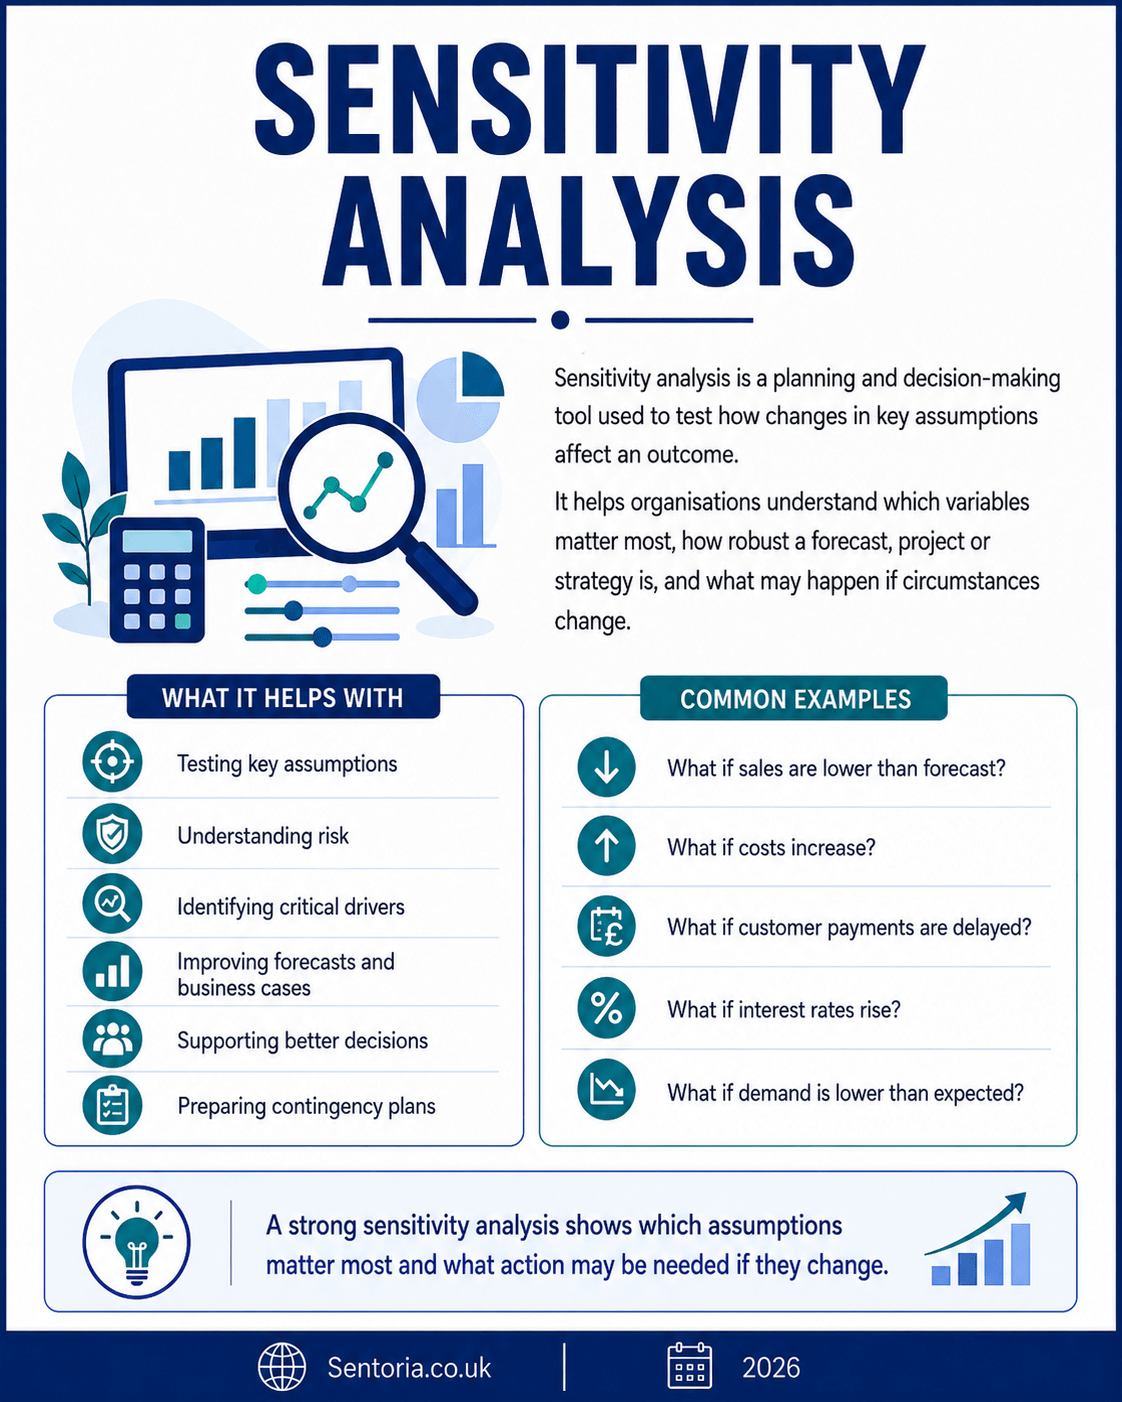
Sensitivity analysis is a planning and decision-making tool used to test how changes in key assumptions affect an outcome.
At its simplest, sensitivity analysis asks:
What happens if one of our assumptions changes?
That makes it useful for forecasting, budgeting, cash flow planning, investment appraisal, property development, project management, charity governance, public sector planning, manufacturing, pricing, risk management and board reporting.
Used properly, sensitivity analysis helps organisations understand which assumptions matter most, where a plan is vulnerable, and what could change the decision.
It does not predict the future. It helps test how robust a forecast, project, investment or strategy is when the future turns out differently from the base case.
What is sensitivity analysis?
Sensitivity analysis examines how changes in one or more input assumptions affect an output.
For example, a business forecast may depend on:
- Sales volume
- Selling price
- Gross margin
- Wage costs
- Rent
- Interest rates
- Customer payment timing
- Stock levels
- Energy costs
- Marketing spend
Sensitivity analysis tests what happens if those assumptions change.
For example:
- What if sales are 10% lower?
- What if wages rise by 6%?
- What if customer payments are delayed by 30 days?
- What if build costs increase by 8%?
- What if interest rates rise by 1%?
- What if occupancy is 85% rather than 95%?
- What if grant funding is delayed?
- What if conversion rates fall?
- What if supplier costs increase?
- What if project completion is delayed?
The output may be:
- Profit
- Cash flow
- Break-even point
- Project cost
- Return on investment
- Net present value
- Internal rate of return
- Funding gap
- Debt covenant position
- Stock requirement
- Staffing need
- Service capacity
The purpose is to identify which variables have the greatest effect.
A forecast may look acceptable under the base case, but become fragile if one or two assumptions move slightly.
Sensitivity analysis helps reveal that fragility.
Sensitivity analysis, scenario analysis and stress testing
Sensitivity analysis is often confused with scenario analysis and stress testing.
They are related, but they are not the same.
Sensitivity analysis
Sensitivity analysis usually changes one assumption at a time to see the effect.
It asks:
Which assumptions have the biggest impact?
Example:
What happens to profit if sales fall by 10%?
Scenario analysis
Scenario analysis changes several assumptions together to create a plausible future situation.
It asks:
What happens under a different overall set of circumstances?
Example:
What happens if sales fall by 10%, wage costs rise by 5%, and customer payments slow by 15 days?
Stress testing
Stress testing examines more severe but plausible conditions.
It asks:
What happens if things become significantly worse than expected?
Example:
What happens if a major customer is lost, sales fall by 25%, and finance costs increase at the same time?
In simple terms:
Sensitivity analysis tests individual assumptions.
Scenario analysis tests combined situations.
Stress testing tests severe pressure.
All three are useful.
History and development of sensitivity analysis
Sensitivity analysis developed from financial modelling, engineering, economics, statistics, risk management and operational planning.
Wherever models are used, assumptions are required. Those assumptions may be about costs, prices, volumes, growth, demand, timing, capacity, inflation, interest rates or human behaviour.
Decision-makers needed a way to understand whether the model was robust or whether small changes could produce very different results.
Sensitivity analysis became especially common in:
- Investment appraisal
- Capital budgeting
- Project finance
- Engineering design
- Forecasting
- Public sector appraisal
- Risk analysis
- Property development
- Energy modelling
- Financial planning
Its popularity comes from a simple idea:
A model is only useful if you understand what drives it.
A spreadsheet may look precise, but precision can be misleading. If the model depends heavily on one uncertain assumption, the decision may be riskier than it first appears.
Sensitivity analysis helps expose that dependency.
Why sensitivity analysis matters
Sensitivity analysis matters because plans are built on assumptions.
Those assumptions may be sensible, researched and reasonable. But they are still assumptions.
A business plan may assume sales growth.
A charity budget may assume grant renewal.
A property appraisal may assume build costs and rental values.
A project plan may assume contractor availability.
A cash flow forecast may assume customers pay on time.
A manufacturing plan may assume supplier lead times.
If those assumptions change, the result may change.
Sensitivity analysis helps organisations:
- Understand uncertainty
- Identify key drivers
- Test financial resilience
- Improve forecasting
- Strengthen risk management
- Challenge optimism
- Support board decisions
- Improve investment appraisal
- Prepare contingency plans
- Understand break-even points
- Prioritise management attention
- Improve communication
- Identify assumptions that need evidence
- Link forecasts to risk appetite
- Avoid false confidence
The value is not simply in producing different numbers.
The value is in understanding what those numbers tell you.
When to use sensitivity analysis
Sensitivity analysis is useful whenever a decision depends on assumptions.
Common uses include:
- Cash flow forecasting
- Budgeting
- Business planning
- Investment appraisal
- Pricing decisions
- Project planning
- Property development
- Construction cost planning
- Charity funding forecasts
- Public sector business cases
- Loan and finance applications
- Stock planning
- Workforce planning
- Manufacturing capacity planning
- Marketing planning
- Service demand forecasting
- Technology projects
- Business continuity planning
- Risk register review
- Board reporting
It is especially useful where:
- The decision is material.
- The assumptions are uncertain.
- The downside could be serious.
- The model is complex.
- The board or management team needs assurance.
- There is a risk of optimism bias.
- The organisation has limited financial capacity.
- The decision involves long-term commitments.
It is less useful if used mechanically without understanding the assumptions being tested.
Sensitivity analysis in different industries
SMEs and owner-managed businesses
For SMEs, sensitivity analysis is especially useful for cash flow and profitability.
Small businesses often have limited room for error. A modest change in sales, margin, customer payments or costs can quickly affect cash.
Typical SME sensitivities include:
- Sales 10% lower than forecast
- Gross margin 2% lower
- Debtor days increasing by 15 days
- Payroll costs increasing by 5%
- Rent or energy costs rising
- A major customer paying late
- Supplier prices increasing
- A loan repayment starting earlier than expected
- Stock holding increasing
- VAT or tax payments being higher than expected
An SME might ask:
- What sales level do we need to break even?
- What happens if customers pay one month later?
- Can we afford to recruit?
- What happens if gross margin falls?
- Which cost increase would hurt most?
- How much cash headroom do we really have?
- Which assumptions need monitoring weekly?
For SMEs, sensitivity analysis should be practical and focused. It should help the owner or management team know what to watch and when to act.
Manufacturing
Manufacturing businesses depend on volumes, materials, labour, energy, machine capacity, quality and delivery.
Typical manufacturing sensitivities include:
- Raw material costs increasing by 5%
- Energy costs increasing by 10%
- Labour productivity falling
- Machine downtime increasing
- Scrap rate increasing
- Sales volume falling
- Supplier lead times lengthening
- Stock levels increasing
- Customer prices being held flat
- Overtime costs rising
A manufacturer might use sensitivity analysis to test:
- Which product lines are most exposed to cost changes?
- What happens if material prices rise?
- How much volume is needed to cover fixed costs?
- What happens if production efficiency falls?
- How much stock can be held before cash pressure appears?
- Can price increases protect margin?
- Which assumptions affect production capacity most?
For manufacturing, sensitivity analysis should link finance, operations, procurement and production planning.
Retail and ecommerce
Retail and ecommerce businesses depend heavily on demand, margin, stock turn, advertising cost, delivery cost and returns.
Typical sensitivities include:
- Conversion rate falling
- Average order value reducing
- Return rate increasing
- Advertising cost increasing
- Gross margin falling
- Supplier prices increasing
- Delivery costs increasing
- Stock sell-through slowing
- Discounting increasing
- Website traffic reducing
An ecommerce business might ask:
- What happens if advertising cost per sale rises?
- What happens if returns increase by 3%?
- How sensitive is profit to gross margin?
- How much stock can be bought safely?
- What happens if peak season sales are lower?
- What happens if delivery costs rise?
- Which product categories carry the most risk?
For retail, sensitivity analysis should avoid focusing only on sales. Revenue without margin and cash control can be misleading.
Professional services
Professional services firms depend on fee income, utilisation, recovery rates, billing, staff costs and client payment timing.
Typical sensitivities include:
- Fee income 10% lower
- Staff utilisation falling
- Work in progress write-offs increasing
- Recovery rates reducing
- Debtor days increasing
- Staff costs increasing
- Fixed-fee work taking longer
- Client pipeline conversion falling
- Key client loss
- Software or insurance costs rising
For accountants, solicitors, consultants, architects and advisers, sensitivity analysis can test:
- How much utilisation is needed to break even?
- What happens if clients pay late?
- Are fixed fees profitable if jobs overrun?
- How sensitive is profit to staff costs?
- What happens if a major client leaves?
- How much advisory income is needed to justify investment?
- What happens if work in progress cannot be billed?
For professional services, sensitivity analysis should connect pricing, capacity, billing and cash collection.
Charities and voluntary organisations
Charities often operate with uncertain income and rising demand.
Typical sensitivities include:
- Grant income reducing
- Donation income falling
- Fundraising events underperforming
- Staff costs increasing
- Service demand rising
- Project costs increasing
- Restricted funding not covering full costs
- Reserves reducing
- Volunteer availability falling
- Public sector funding being delayed
A charity might ask:
- What happens if a major grant is not renewed?
- How long will reserves last under a deficit?
- What happens if demand rises by 20%?
- Can restricted funding cover full delivery cost?
- What level of unrestricted income is needed?
- What happens if payroll costs rise?
- What service reductions would be required in a downside case?
For charities, sensitivity analysis should link to reserves policy, funding strategy, risk register and trustee decision-making.
It should not focus only on money. It should also consider service impact and beneficiary outcomes.
Public sector and local government
Public bodies use sensitivity analysis for budgets, demand forecasts, service planning, business cases and policy options.
Typical sensitivities include:
- Demand increasing above forecast
- Inflation exceeding budget
- Grant funding reducing
- Procurement costs rising
- Project costs increasing
- Savings plans being delayed
- Staff costs increasing
- Service user numbers rising
- Interest rates changing
- Contractor costs increasing
A public body might ask:
- What happens if demand for a statutory service rises?
- What happens if savings are delayed?
- What happens if inflation is higher than budget?
- What is the financial impact of a policy change?
- What happens if capital costs increase?
- Which assumptions in the business case are most important?
- What does this mean for value for money?
For public sector work, sensitivity analysis should be transparent, evidence-based and linked to decision-making.
Property and construction
Property and construction projects are highly sensitive to cost, timing, finance, planning and market assumptions.
Typical sensitivities include:
- Build costs increasing by 5% or 10%
- Planning approval being delayed
- Interest rates increasing
- Rental values reducing
- Sales values reducing
- Occupancy being lower than expected
- Void periods increasing
- Contractor costs rising
- Professional fees increasing
- Exit yield changing
A property appraisal might test:
- What happens if build costs rise?
- What happens if rent is lower?
- What happens if interest rates rise?
- What happens if completion is delayed by six months?
- What happens if sales take longer?
- What happens if occupancy is lower?
- What is the break-even rent or sale price?
- What contingency is needed?
For property and construction, sensitivity analysis is essential because small percentage changes can have large financial consequences.
Technology and software
Technology businesses depend on customer acquisition, churn, usage, pricing, support cost, development cost and infrastructure.
Typical sensitivities include:
- Customer acquisition cost increasing
- Conversion rate falling
- Churn increasing
- Average revenue per user reducing
- Hosting costs increasing
- Development timeline extending
- Support tickets increasing
- Product adoption slowing
- Sales cycle lengthening
- Funding being delayed
A software business might ask:
- What happens if churn rises from 4% to 7%?
- What happens if customer acquisition cost doubles?
- How many customers are needed to break even?
- What happens if development takes three months longer?
- What happens if hosting costs rise with usage?
- Which metric matters most to cash burn?
- How sensitive is valuation to recurring revenue growth?
For technology businesses, sensitivity analysis should focus on the drivers of recurring revenue, retention, growth and cash runway.
Healthcare and social care
Healthcare and social care organisations can use sensitivity analysis for staffing, demand, funding, care hours and cost pressures.
Typical sensitivities include:
- Staff costs increasing
- Agency use increasing
- Demand rising
- Occupancy reducing
- Funding rates changing
- Care hours increasing
- Training costs increasing
- Regulatory compliance costs rising
- Sickness absence increasing
- Transport costs increasing
A care provider might ask:
- What happens if agency costs rise?
- What happens if occupancy falls?
- What staffing level is financially sustainable?
- What happens if care needs increase?
- What happens if funding rates do not keep up with wage costs?
- What level of sickness absence creates service risk?
- What is the cash impact of delayed funding?
In healthcare and care, sensitivity analysis should support safe and sustainable planning. It should not be used to justify unsafe staffing or poor service quality.
Education and training
Education providers use sensitivity analysis for learner numbers, funding, staffing, course viability and digital delivery.
Typical sensitivities include:
- Enrolment falling
- Completion rates reducing
- Funding rates changing
- Tutor costs increasing
- Attendance falling
- Employer placements reducing
- Digital platform costs increasing
- Learner support needs increasing
- Assessment costs rising
- Course demand changing
An education provider might ask:
- How many learners are needed for a course to break even?
- What happens if enrolment is 15% lower?
- What happens if completion rates fall?
- What happens if funding rules change?
- What staffing is needed for different learner volumes?
- What happens if digital delivery costs increase?
- Which courses are most financially sensitive?
For education, sensitivity analysis should link financial sustainability with learner outcomes and quality.
How to carry out sensitivity analysis properly
1. Define the decision
Start by identifying the decision or model being tested.
For example:
- Should we approve this budget?
- Should we invest in this project?
- Should we accept this contract?
- Should we buy this property?
- Should we launch this service?
- Can we afford to recruit?
- Can we sustain current activity?
- Do we have enough cash?
- Is the forecast realistic?
- What are the main risks?
Sensitivity analysis should be tied to a decision.
Without a decision, the exercise can become unfocused.
2. Identify the output
Decide what result matters.
The output might be:
- Profit
- Cash balance
- Funding gap
- Project cost
- Return on investment
- Net present value
- Break-even point
- Gross margin
- Debt level
- Reserves
- Payback period
- Capacity requirement
The output should match the decision.
For example, if the decision is about affordability, cash flow may matter more than accounting profit.
3. Identify the key assumptions
List the assumptions that drive the model.
These may include:
- Sales volume
- Price
- Gross margin
- Cost inflation
- Wage growth
- Customer payment timing
- Supplier costs
- Interest rates
- Build costs
- Occupancy
- Demand
- Conversion rate
- Churn
- Funding income
- Project duration
Do not test everything equally.
Focus on the assumptions that are uncertain and important.
4. Record the base case
The base case is the main forecast or expected outcome.
For example:
Base case: Sales of £1,000,000, gross margin of 40%, overheads of £320,000, resulting in profit of £80,000.
The base case should be documented clearly.
It should show:
- Input assumptions
- Output result
- Evidence
- Date prepared
- Owner
- Version
A sensitivity analysis without a clear base case is difficult to interpret.
5. Change one assumption at a time
Basic sensitivity analysis changes one input while keeping others constant.
For example:
- Sales volume falls by 5%, 10% and 15%.
- Gross margin falls by 1%, 2% and 3%.
- Wage costs rise by 3%, 5% and 8%.
- Debtor days increase by 15, 30 and 45 days.
- Build costs rise by 5%, 10% and 15%.
This helps show which assumption has the greatest effect.
6. Use realistic ranges
The changes tested should be realistic.
Avoid testing only comfortable changes.
For example, if build costs have recently been volatile, testing only a 1% increase may be weak.
If customer payments are already unpredictable, testing only a five-day delay may not show the real risk.
Use evidence where possible:
- Historic variation
- Market data
- Supplier quotes
- Inflation trends
- Previous projects
- Customer behaviour
- Sector benchmarks
- Professional judgement
The range should be wide enough to be useful.
7. Show the impact clearly
Present the results in a way decision-makers can understand.
Useful formats include:
- Sensitivity table
- Tornado chart
- Scenario table
- Break-even table
- Cash impact table
- Red, amber and green rating
- Commentary by assumption
- Board summary
- Graph
- Dashboard
The aim is clarity.
A good sensitivity analysis should show which assumptions matter most without requiring the reader to inspect every cell in a spreadsheet.
8. Identify trigger points
Sensitivity analysis should identify points where action is needed.
Examples include:
- Sales falling below break-even.
- Cash dropping below minimum headroom.
- Reserves falling below policy level.
- Project return becoming negative.
- Debt covenant being breached.
- Staff capacity becoming insufficient.
- Service quality becoming unsafe.
- Gross margin falling below target.
- Build cost contingency being exhausted.
- Customer concentration becoming unacceptable.
Trigger points help management act early.
9. Link to risk and action
The results should feed into wider management tools.
For example:
- Add key sensitivities to the risk register.
- Record uncertain assumptions in the assumptions log.
- Update the forecast.
- Prepare a contingency plan.
- Adjust the risk appetite assessment.
- Revise the budget.
- Delay or stop a project.
- Seek more evidence.
- Negotiate with suppliers.
- Change pricing.
- Strengthen cash controls.
- Brief the board or trustees.
Sensitivity analysis should not end with a table. It should lead to decisions.
10. Review and update
Sensitivity analysis should be updated when assumptions change.
Review when:
- Actual results differ from forecast.
- Costs change.
- Income changes.
- Market conditions change.
- Funding changes.
- A supplier position changes.
- A project is delayed.
- Interest rates move.
- Demand changes.
- The board asks for assurance.
A sensitivity analysis prepared six months ago may no longer be useful.
Common sensitivity analysis techniques
One-way sensitivity analysis
One-way sensitivity analysis changes one assumption at a time.
Example:
What happens to profit if sales volume falls by 10%?
This is simple and useful.
It helps identify which single variables have the greatest effect.
Two-way sensitivity analysis
Two-way sensitivity analysis changes two assumptions at the same time.
Example:
What happens to profit at different combinations of sales volume and gross margin?
This is useful when two assumptions interact.
For example:
- Price and volume
- Rent and occupancy
- Build cost and sale value
- Churn and customer acquisition
- Staffing cost and demand
- Interest rate and debt level
Tornado analysis
A tornado chart ranks assumptions by their effect on the outcome.
The assumptions with the largest impact appear at the top.
This is useful for showing decision-makers which assumptions matter most.
It is called a tornado chart because the bars often create a tornado-like shape.
Break-even analysis
Break-even analysis identifies the point at which income covers costs.
Examples include:
- Units needed to break even
- Sales required to cover overheads
- Occupancy needed to cover property costs
- Learners needed to make a course viable
- Clients needed to support a service
- Rent needed to support a development
Break-even analysis is a practical form of sensitivity testing because it asks:
How far can assumptions move before the model no longer works?
Margin of safety analysis
Margin of safety shows how much actual performance can fall before the organisation reaches break-even or another critical threshold.
For example:
If forecast sales are £1,000,000 and break-even sales are £800,000, the margin of safety is £200,000.
That means sales could fall by 20% before break-even is reached.
This is useful for assessing resilience.
Sensitivity table
A sensitivity table shows how the output changes under different input values.
For example:
| Sales change | Forecast profit |
|---|---|
| Base case | £80,000 |
| Sales down 5% | £50,000 |
| Sales down 10% | £20,000 |
| Sales down 15% | £10,000 loss |
This is simple and easy to understand.
Common mistakes in sensitivity analysis
Mistake 1: Testing the wrong assumptions
Sensitivity analysis is weak if it tests assumptions that do not matter.
Focus on the assumptions that are both uncertain and important.
Mistake 2: Testing only comfortable changes
If the analysis only tests small changes, it may give false reassurance.
The range should reflect realistic downside possibilities.
Mistake 3: Ignoring combined effects
One-way sensitivity analysis is useful, but real life often changes several assumptions at once.
Scenario analysis may also be needed.
Mistake 4: Using poor base case data
If the base case is wrong, the sensitivity analysis may be misleading.
The starting model must be credible.
Mistake 5: Not linking to action
Sensitivity analysis should lead to decisions.
If nothing changes after the analysis, it may not have been used properly.
Mistake 6: Treating the model as precise
A spreadsheet can create false precision.
Sensitivity analysis should improve judgement, not pretend certainty.
Mistake 7: Ignoring cash flow
Profit sensitivity is useful, but cash timing may be more important.
A project may be profitable but still create cash pressure.
Mistake 8: Ignoring risk appetite
A sensitivity may show that an outcome is still profitable, but outside the organisation’s risk appetite.
For example, reserves may fall below the agreed minimum.
Mistake 9: Not documenting assumptions
If assumptions are not recorded, the analysis cannot be reviewed or challenged properly.
Mistake 10: Not updating the analysis
Assumptions change.
Old sensitivity analysis can become misleading if not updated.
Limitations and weaknesses of sensitivity analysis
Sensitivity analysis is useful, but it has limits.
It usually tests assumptions, not certainties
The analysis depends on the assumptions chosen.
If an important assumption is missed, the analysis may be incomplete.
One-way analysis can be too simple
Changing one variable at a time is useful, but real-world changes often happen together.
For example, sales may fall at the same time as customer payments slow and costs rise.
It depends on model quality
Sensitivity analysis cannot fix a poor model.
If formulas, data or logic are wrong, the results may be unreliable.
It can create false confidence
A neat table can look authoritative.
The analysis is only as good as the thinking behind it.
It may not capture extreme events
Sensitivity analysis often tests reasonable ranges.
Severe shocks may need stress testing or scenario planning.
It can be misunderstood
Some readers may think the sensitivity table shows what will happen.
It does not. It shows what would happen if certain assumptions changed.
It does not make the decision
Sensitivity analysis supports judgement.
It does not replace leadership, governance or accountability.
It can become too complex
Testing too many assumptions can confuse decision-makers.
The analysis should focus on what matters most.
Sensitivity analysis compared with other strategic and management tools
Sensitivity analysis and forecasting
Forecasting estimates likely future outcomes.
Sensitivity analysis tests how the forecast changes when assumptions change.
Use forecasting to build the base case. Use sensitivity analysis to test its robustness.
Sensitivity analysis and scenario planning
Sensitivity analysis usually changes one assumption at a time.
Scenario planning examines different possible futures.
Use sensitivity analysis to identify key drivers. Use scenario planning to explore wider uncertainty.
Sensitivity analysis and assumptions log
An assumptions log records what the plan depends on.
Sensitivity analysis shows which assumptions matter most.
The most sensitive assumptions should usually be recorded and monitored.
Sensitivity analysis and risk register
Sensitivity analysis can reveal risks.
For example, if a small change in sales creates a cash shortfall, that should be considered in the risk register.
Sensitivity analysis and risk appetite statement
Sensitivity analysis helps test whether a plan remains within risk appetite.
For example, if a downside case reduces reserves below the approved minimum, the plan may be outside appetite.
Sensitivity analysis and business continuity plan
Sensitivity analysis can support business continuity by testing how disruption affects cash, staffing, service capacity or recovery times.
Sensitivity analysis and horizon scanning
Horizon scanning identifies emerging changes.
Sensitivity analysis can test what those changes might mean financially or operationally.
Sensitivity analysis and internal audit
Internal audit can review whether significant models include appropriate sensitivity analysis and whether assumptions are properly evidenced.
Sensitivity analysis and investment appraisal
Investment appraisal assesses whether a project or investment is worthwhile.
Sensitivity analysis tests how that appraisal changes if key assumptions move.
Sensitivity analysis and break-even analysis
Break-even analysis identifies the point where income equals costs.
It is often one of the most practical forms of sensitivity analysis.
Alternatives and complementary frameworks
Scenario analysis
Use scenario analysis to test several assumptions changing together.
Best used where future conditions may differ significantly from the base case.
Stress testing
Use stress testing to assess severe but plausible downside conditions.
Best used where resilience, solvency or continuity matter.
Monte Carlo simulation
Use Monte Carlo simulation where many uncertain variables interact and probability ranges are useful.
Best used for complex financial, project, engineering or risk models.
Break-even analysis
Use break-even analysis to identify the minimum sales, occupancy, volume or income required.
Best used for pricing, product launch, service viability and investment decisions.
Assumptions log
Use an assumptions log to record and monitor important assumptions.
Best used where assumptions are material, uncertain or need validation.
Risk register
Use the risk register to manage risks revealed by sensitivity analysis.
Forecast variance analysis
Use variance analysis to compare actual results with forecast and improve future assumptions.
Business case review
Use a business case review to assess whether the overall case remains valid as assumptions change.
A practical sensitivity analysis template
A useful sensitivity analysis template should include:
- Decision being tested
- Model or forecast name
- Base case
- Key assumptions
- Output measure
- Sensitivity tested
- Range tested
- Result of each sensitivity
- Impact on output
- Risk rating
- Trigger point
- Mitigating action
- Assumption owner
- Linked risk register reference
- Linked assumptions log reference
- Review date
- Conclusion
- Decision required
- Version control
- Prepared by
Example:
Decision: Whether to approve a new service launch.
Base case: 100 customers in year one, average fee £1,200, gross margin 45%, resulting in forecast contribution of £54,000.
Sensitivity tested: Customer numbers.
Results:
- 100 customers: contribution £54,000.
- 80 customers: contribution £36,000.
- 60 customers: contribution £18,000.
- 45 customers: break-even.
- Below 45 customers: loss-making.
Conclusion: The service is highly sensitive to customer numbers. A pilot should be completed before full launch, and marketing spend should be staged until early demand is proven.
Questions to ask during sensitivity analysis
Purpose questions
- What decision are we testing?
- What model are we using?
- What output matters most?
- Who will use the analysis?
- What level of detail is needed?
- What action may follow?
- What uncertainty are we trying to understand?
- What would change the decision?
- What would make the analysis useful?
- When should it be reviewed?
Assumption questions
- What are the key assumptions?
- Which assumptions are most uncertain?
- Which assumptions are most important?
- What evidence supports each assumption?
- Are any assumptions optimistic?
- Are any assumptions outdated?
- Are assumptions documented?
- Should they be added to the assumptions log?
- Who owns each assumption?
- When should they be checked?
Model questions
- Is the base model reliable?
- Are formulas correct?
- Is the data accurate?
- Is the model easy to understand?
- Does it include cash timing?
- Does it include fixed and variable costs properly?
- Does it reflect the real drivers?
- Are outputs clearly shown?
- Is version control in place?
- Has the model been reviewed?
Sensitivity questions
- What happens if sales fall?
- What happens if costs rise?
- What happens if income is delayed?
- What happens if demand is lower?
- What happens if interest rates rise?
- What happens if margins fall?
- What happens if the project takes longer?
- What happens if occupancy is lower?
- What happens if funding is not secured?
- What happens if several factors move together?
Risk questions
- Which sensitivity creates the biggest risk?
- Which assumption could cause a cash shortfall?
- Which assumption could make the project unviable?
- Which assumption could breach risk appetite?
- Which assumption requires contingency?
- Which risk should be added to the risk register?
- Which assumption needs monitoring?
- Which sensitivity needs board attention?
- Which downside is acceptable?
- Which downside is unacceptable?
Action questions
- What should we do as a result?
- Do we need more evidence?
- Should the project be changed?
- Should approval be delayed?
- Should contingency be increased?
- Should pricing be changed?
- Should costs be reduced?
- Should funding be secured first?
- Should risk controls be strengthened?
- Who owns the next action?
The best way to think about sensitivity analysis
Sensitivity analysis is not about proving that a plan works.
It is about understanding how a plan could fail, weaken or improve if assumptions change.
A good sensitivity analysis should be:
- Clear
- Practical
- Assumption-led
- Evidence-based
- Focused on key drivers
- Linked to decisions
- Linked to risk
- Linked to action
- Easy to understand
- Regularly reviewed
A weak sensitivity analysis says:
“Here are some alternative numbers.”
A strong sensitivity analysis asks:
“Which assumptions matter most, what happens if they change, and what should we do about it?”
The key question is not simply:
What happens if this number changes?
The better question is:
Does this change affect the decision, the risk, the cash position, the strategy or the action required?
Conclusion: sensitivity analysis turns assumptions into better decisions
Sensitivity analysis remains useful because forecasts, budgets, projects and strategies all rely on assumptions.
Some assumptions will be right. Some will be wrong. Some will change over time.
Used badly, sensitivity analysis becomes a mechanical spreadsheet exercise with little influence on decisions.
Used properly, it becomes a practical management tool. It helps organisations understand uncertainty, identify key drivers, challenge optimism, protect cash, improve risk management and make better decisions.
The real value is not in changing numbers.
The real value is in understanding what changes matter.
A strong sensitivity analysis helps an organisation move from saying, “This is our forecast,” to asking, “What assumptions drive it, what happens if they change, and are we still comfortable with the decision?”