Benchmarking:
A Practical Guide to Comparing Performance, Learning from Others and Improving Results
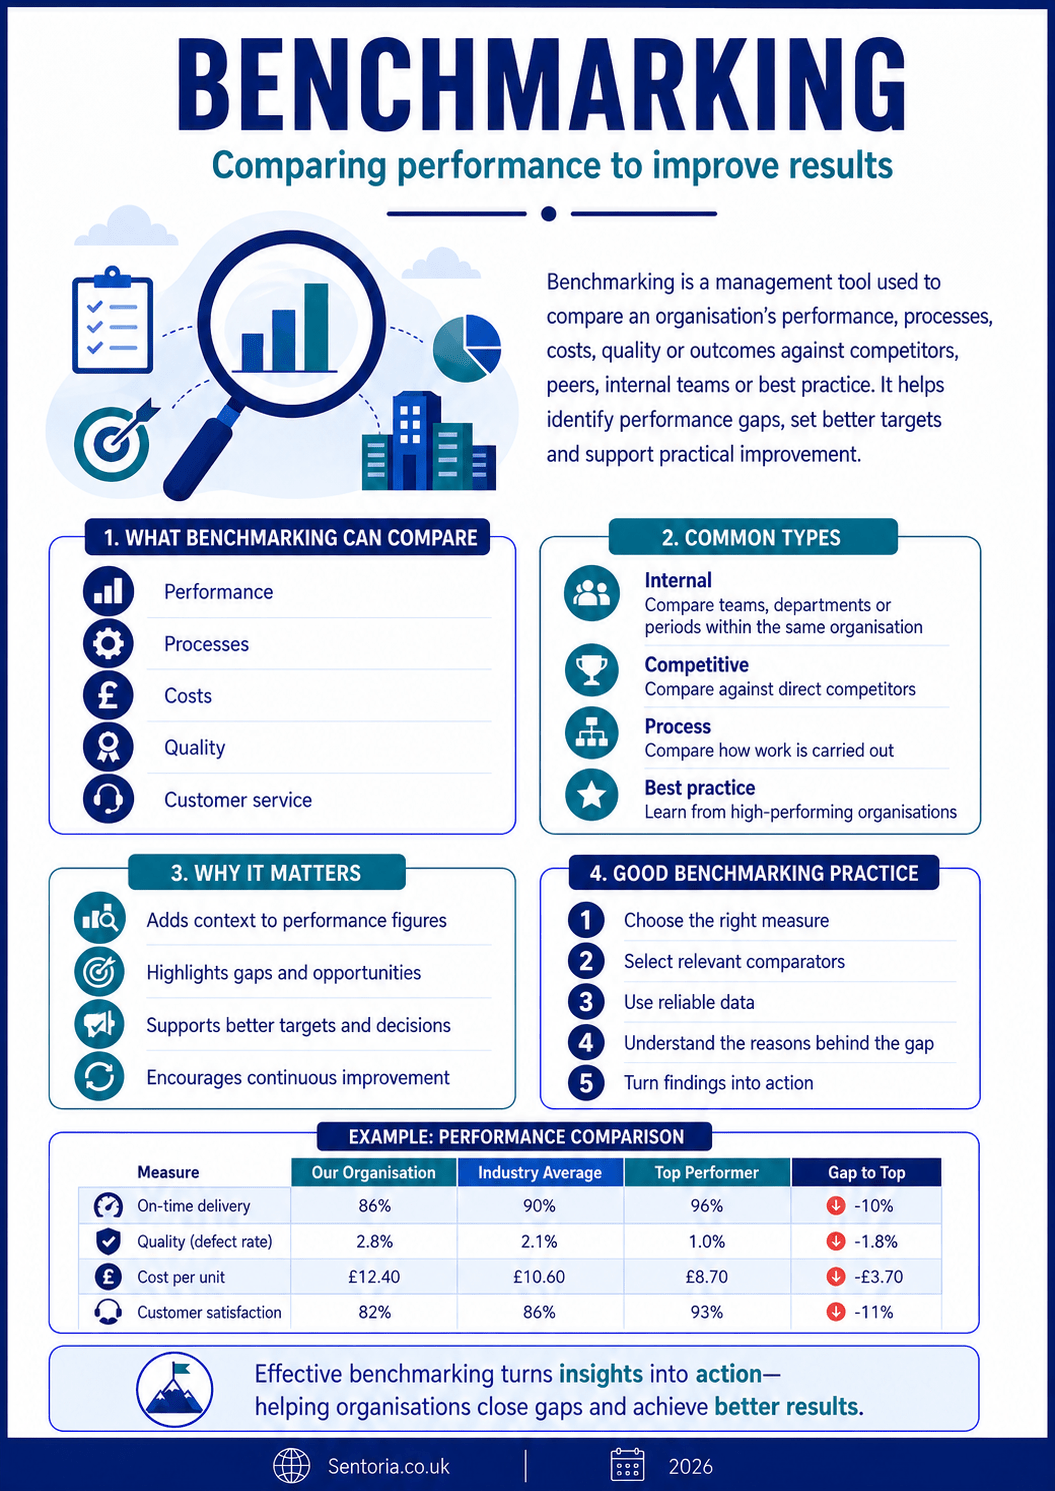
Benchmarking is a practical management and improvement tool used to compare an organisation’s performance, processes, costs, quality, service or outcomes against relevant standards, competitors, peers or best practice.
At its simplest, benchmarking asks:
How do we compare, who performs better, what can we learn, and what should we improve?
That makes it useful for strategy, operational improvement, financial management, customer service, productivity, quality, pricing, internal audit, risk management, charity governance, public sector performance, manufacturing, retail, professional services, property, technology, healthcare and education.
Used properly, benchmarking helps organisations move from opinion to evidence. It can show whether performance is strong, weak, average, improving, falling behind or capable of being improved.
It is not about copying others blindly. It is about learning intelligently.
What is benchmarking?
Benchmarking is the process of comparing performance, practice or outcomes against a meaningful reference point.
That reference point may be:
- A competitor
- A peer organisation
- An industry average
- A recognised standard
- A regulatory expectation
- A best practice example
- A historic internal result
- A different department
- A different site
- A different project
- A target
- A customer expectation
- A service level agreement
- A quality standard
- A public dataset
Benchmarking may examine:
- Cost
- Speed
- Quality
- Productivity
- Customer satisfaction
- Staff turnover
- Profit margin
- Cash collection
- Stock turn
- Defect rates
- Response times
- Website conversion
- Service demand
- Complaints
- Project delivery
- Energy use
- Safety performance
- Funding mix
- Occupancy
- Learner or service user outcomes
The purpose is to understand relative performance.
A figure on its own may not mean much.
For example:
Debtor days are 52 days.
That might be good, average or poor depending on the sector, customer base and credit terms.
Benchmarking adds context:
Debtor days are 52 days compared with a sector average of 38 days and an internal target of 40 days.
That comparison makes the issue clearer.
Benchmarking, targets and KPIs
Benchmarking is often confused with targets and key performance indicators.
They are connected, but they are not the same.
Benchmarking
Benchmarking compares performance or practice against a reference point.
It asks:
How do we compare?
Targets
Targets set a desired level of performance.
They ask:
What level are we aiming for?
KPIs
Key performance indicators measure progress against important objectives.
They ask:
What should we track to understand performance?
In simple terms:
KPIs measure performance.
Targets define the desired level.
Benchmarking shows how that performance compares.
For example:
KPI: Customer response time.
Target: Respond to 95% of enquiries within one working day.
Benchmark: Competitor or sector standard is same-day response for 90% of enquiries.
Benchmarking helps decide whether the target is ambitious, realistic or too weak.
History and development of benchmarking
Benchmarking developed from quality management, manufacturing, productivity improvement, competitive analysis and operational excellence.
Organisations have always compared themselves with others. Traders compared prices. Manufacturers compared productivity. Public bodies compared service levels. Professional firms compared fee recovery. Retailers compared sales per square foot. Boards compared margins, costs and returns.
Modern benchmarking became more structured as organisations adopted quality management and continuous improvement methods. Rather than relying only on internal targets, organisations began to study how better-performing organisations achieved superior results.
Benchmarking became particularly associated with identifying best practice.
The focus moved from simply asking:
Are we performing well?
to asking:
Who performs better, how do they do it, and what can we learn?
Over time, benchmarking expanded beyond manufacturing and quality. It is now used across finance, operations, customer service, digital performance, public services, charities, professional services, technology, healthcare, education, sustainability and governance.
The reason is simple.
Most organisations cannot understand performance properly by looking only at themselves.
Why benchmarking matters
Benchmarking matters because internal performance measures can be misleading.
An organisation may think it is performing well because it has improved compared with last year.
But competitors may have improved faster.
A charity may believe its administration costs are reasonable.
But peer comparison may show that delivery costs are high.
A business may believe its customer service is strong.
But customer response times may be slower than sector expectations.
A public body may believe a service is efficient.
But comparable authorities may deliver better outcomes at lower cost.
Benchmarking helps organisations:
- Understand relative performance
- Identify gaps
- Challenge complacency
- Support continuous improvement
- Set better targets
- Improve productivity
- Improve cost control
- Improve customer service
- Identify best practice
- Support board reporting
- Improve strategic decisions
- Improve value for money
- Inform pricing
- Improve operational processes
- Support investment decisions
- Identify training needs
- Improve quality
- Strengthen accountability
- Improve risk management
- Support change programmes
Benchmarking can also help avoid two common mistakes.
The first mistake is false comfort.
We are better than last year, so we must be doing well.
The second mistake is false panic.
This number looks bad, so something must be wrong.
Benchmarking gives context.
When to use benchmarking
Benchmarking is useful whenever an organisation needs to understand relative performance or learn from better practice.
Good uses include:
- Reviewing financial performance
- Comparing costs
- Improving productivity
- Reviewing customer service
- Improving quality
- Reviewing pricing
- Setting targets
- Preparing a business plan
- Supporting strategic planning
- Improving operational processes
- Reviewing staffing levels
- Assessing value for money
- Reviewing charity overheads
- Comparing public services
- Improving project delivery
- Reviewing procurement
- Assessing digital performance
- Reviewing property performance
- Supporting internal audit
- Preparing board reports
It is especially useful where:
- Performance is unclear.
- Costs are rising.
- Service standards are inconsistent.
- A board wants assurance.
- Management suspects underperformance.
- A process needs improvement.
- Targets feel arbitrary.
- Competitors appear stronger.
- Customers expect more.
- The organisation wants to improve but does not know what good looks like.
It is less useful when the comparison is unfair, irrelevant or poorly understood.
Types of benchmarking
1. Internal benchmarking
Internal benchmarking compares performance within the same organisation.
Examples include:
- One branch compared with another branch
- One department compared with another department
- One production line compared with another production line
- One project compared with another project
- One team compared with another team
- Current year compared with prior year
- One property compared with another property
- One customer segment compared with another segment
- One service area compared with another service area
- One campaign compared with another campaign
Internal benchmarking is useful because data is usually easier to access and definitions are more consistent.
For example, a business may compare:
- Sales conversion by salesperson
- Gross margin by product line
- Debtor days by customer group
- Complaints by service team
- Productivity by site
- Energy use by building
- Staff turnover by department
Internal benchmarking helps identify where good practice already exists inside the organisation.
2. Competitive benchmarking
Competitive benchmarking compares performance with direct competitors.
Examples include:
- Pricing
- Service levels
- Website experience
- Product range
- Customer reviews
- Delivery times
- Features
- Marketing messages
- Quality claims
- Publicly available financial performance
Competitive benchmarking is useful for understanding market position.
However, competitor data can be hard to obtain and may not be directly comparable.
It is important to use public information ethically and avoid improper collection of confidential competitor information.
3. Functional benchmarking
Functional benchmarking compares similar functions across different organisations, even if they are not direct competitors.
For example:
- Finance team efficiency
- HR response times
- Procurement cycle time
- Customer service handling time
- Warehouse productivity
- IT helpdesk performance
- Payroll processing cost
- Marketing conversion rates
- Project delivery methods
- Complaints handling
This is useful because good practice may come from outside the sector.
A charity might learn from customer service practice in retail.
A manufacturer might learn from logistics practice in ecommerce.
A public body might learn from digital onboarding in banking.
4. Process benchmarking
Process benchmarking compares how work is done.
It asks:
How do better-performing organisations or teams carry out this process?
Examples include:
- Purchase order processing
- Sales enquiry handling
- Customer onboarding
- Month-end reporting
- Stock control
- Recruitment
- Complaint handling
- Project approval
- Maintenance scheduling
- Invoice approval
Process benchmarking is useful because it moves beyond the result and examines the cause.
It does not only ask:
What is their performance?
It asks:
What are they doing differently?
5. Performance benchmarking
Performance benchmarking compares measurable results.
Examples include:
- Gross margin
- Net profit margin
- Cost per unit
- Revenue per employee
- Customer satisfaction
- Response time
- Conversion rate
- Defect rate
- Occupancy
- Stock turn
- Project overrun
- Staff turnover
- Absence rate
- Energy consumption
- Complaints per customer
Performance benchmarking is useful for identifying gaps and setting targets.
It should be combined with process benchmarking where improvement is required.
6. Strategic benchmarking
Strategic benchmarking compares broader strategic choices.
It asks:
How do other organisations compete, position themselves, structure their business model or create value?
Examples include:
- Pricing model
- Route to market
- Customer segment focus
- Product mix
- Service model
- Partnership model
- Digital strategy
- Operating model
- Funding model
- Governance model
Strategic benchmarking is useful when an organisation is reviewing direction, not just operational performance.
7. Best practice benchmarking
Best practice benchmarking compares against recognised high performers.
It asks:
What does excellent performance look like, and what makes it possible?
This may involve studying:
- Sector leaders
- Award-winning organisations
- High-performing teams
- Recognised standards
- Professional guidance
- Case studies
- Specialist research
- Benchmarking clubs
- Industry groups
- Public datasets
The danger is that best practice may not transfer directly.
The organisation must consider context, resources, culture, scale and customer needs.
Benchmarking in different industries
SMEs and owner-managed businesses
For SMEs, benchmarking should be practical and proportionate.
A small business does not need a complex benchmarking programme. It does need to understand whether its key numbers and processes are healthy.
Typical SME benchmarks include:
- Gross margin
- Net profit margin
- Revenue per employee
- Labour cost as a percentage of sales
- Debtor days
- Stock turn
- Average order value
- Customer retention
- Sales conversion
- Website enquiries
- Customer reviews
- Response times
- Repeat purchase rate
- Overheads as a percentage of sales
- Cash reserves
An SME might ask:
- Are our margins strong enough?
- Are our costs high compared with similar businesses?
- Are customers paying more slowly than expected?
- Are we charging enough?
- Are we converting enough enquiries?
- Are we too dependent on one customer?
- Are competitors offering something we are not?
- Is our service level good enough?
For SMEs, benchmarking should support action.
A benchmark that does not lead to a decision is only an interesting comparison.
Manufacturing
Manufacturing businesses use benchmarking for productivity, quality, cost, safety, energy, stock and delivery.
Typical manufacturing benchmarks include:
- Output per labour hour
- Defect rate
- Scrap rate
- Machine utilisation
- Overall equipment effectiveness
- Downtime
- On-time delivery
- Stock turn
- Raw material yield
- Energy cost per unit
- Labour cost per unit
- Warranty claims
- Health and safety incidents
- Lead time
- Rework cost
A manufacturer might ask:
- Are we producing efficiently?
- Which line performs best?
- Why does one shift have fewer defects?
- Are material costs higher than peers?
- Are energy costs too high?
- Is stock holding excessive?
- Are lead times competitive?
- What practice can be transferred from better-performing areas?
For manufacturing, benchmarking should connect financial performance with operational reality.
A margin issue may be caused by productivity, waste, downtime, pricing, quality or purchasing.
Retail and ecommerce
Retail and ecommerce businesses use benchmarking for sales, conversion, customer experience, stock, returns and marketing efficiency.
Typical benchmarks include:
- Conversion rate
- Average order value
- Basket abandonment
- Customer acquisition cost
- Return rate
- Gross margin
- Stock turn
- Repeat purchase rate
- Delivery time
- Review score
- Website speed
- Email open rate
- Paid advertising return
- Customer lifetime value
- Revenue per visitor
A retailer might ask:
- Is our conversion rate competitive?
- Is our return rate too high?
- Are delivery expectations being met?
- Are competitors cheaper, faster or clearer?
- Are product pages effective?
- Which category has the best margin?
- Which marketing channel performs best?
- Are reviews showing a service gap?
For ecommerce, benchmarking should not focus only on revenue.
Revenue without margin, repeat purchase and cash control can mislead.
Professional services
Professional services firms use benchmarking for utilisation, recovery, billing, pricing, client service and profitability.
Typical benchmarks include:
- Revenue per fee earner
- Utilisation rate
- Recovery rate
- Write-off percentage
- Work in progress days
- Debtor days
- Average fee
- Client retention
- Proposal conversion
- Staff turnover
- Profit per partner or director
- Fee growth
- Recurring income
- Client satisfaction
- Deadline performance
For accountants, solicitors, consultants, architects and advisers, benchmarking might ask:
- Are we recovering enough of our time?
- Are fixed fees profitable?
- Are clients paying too slowly?
- Are we undercharging compared with value delivered?
- Are staff overloaded?
- Are advisory services growing?
- Are we more reactive than competitors?
- Are our service standards consistent?
Professional services firms should benchmark both financial performance and client experience.
High utilisation with poor client service is not sustainable.
Charities and voluntary organisations
Charities use benchmarking to understand service delivery, funding, reserves, governance, impact and efficiency.
Typical charity benchmarks include:
- Cost per beneficiary
- Income mix
- Funder concentration
- Unrestricted reserves
- Administration cost ratio
- Fundraising return
- Volunteer retention
- Service demand
- Staff turnover
- Safeguarding training completion
- Grant success rate
- Beneficiary outcomes
- Trustee attendance
- Programme delivery cost
- Restricted fund utilisation
A charity might ask:
- Are we too dependent on one funder?
- Are reserves adequate compared with risk?
- Are service delivery costs reasonable?
- Are volunteer retention rates healthy?
- Are outcomes improving?
- Are fundraising activities worthwhile?
- Are we reaching the intended beneficiaries?
- Are governance practices strong enough?
For charities, benchmarking should be used carefully.
Low overhead is not automatically good if it weakens governance, safeguarding, fundraising or service quality.
Public sector and local government
Public bodies use benchmarking for value for money, service quality, demand, cost and outcomes.
Typical public sector benchmarks include:
- Cost per service user
- Processing time
- Waiting time
- Customer satisfaction
- Complaint rate
- Demand per population
- Staff absence
- Unit cost
- Service outcomes
- Digital uptake
- Call handling time
- Contract cost
- Budget variance
- Statutory performance measures
- Resident satisfaction
A public body might ask:
- Are service costs reasonable?
- Are outcomes comparable with peer authorities?
- Are waiting times too long?
- Are residents using digital channels?
- Are complaints higher than peers?
- Are savings plans realistic?
- Which areas show best practice?
- Where is value for money weak?
For public services, benchmarking should consider context.
Demographics, deprivation, geography, funding, statutory duties and local need can all affect comparability.
Property and construction
Property and construction organisations use benchmarking for costs, rents, occupancy, project performance, maintenance and asset management.
Typical benchmarks include:
- Rent per square foot
- Occupancy rate
- Void period
- Service charge cost
- Maintenance cost per property
- Build cost per square foot
- Project cost variance
- Programme delay
- Defects
- Energy performance
- Tenant retention
- Arrears
- Contractor performance
- Yield
- Capital expenditure per asset
A property business might ask:
- Are rents aligned with the market?
- Are void periods too long?
- Are maintenance costs rising faster than comparable assets?
- Are service charges reasonable?
- Is build cost within market expectations?
- Are contractors performing well?
- Are tenants satisfied?
- Which assets underperform?
For property and construction, benchmarking should link to valuation, viability, tenant experience, risk and long-term asset strategy.
Technology and software
Technology businesses use benchmarking for growth, product usage, customer success, development, reliability and commercial performance.
Typical benchmarks include:
- Monthly recurring revenue growth
- Churn
- Customer acquisition cost
- Customer lifetime value
- Conversion rate
- Trial to paid conversion
- Uptime
- Response time
- Support tickets per user
- Feature adoption
- Net revenue retention
- Development cycle time
- Bug resolution time
- Hosting cost per user
- Onboarding completion
A software business might ask:
- Is churn too high?
- Is acquisition cost sustainable?
- Are users adopting key features?
- Is support demand higher than expected?
- Are systems reliable enough?
- Is the product roadmap improving customer outcomes?
- Are competitors growing faster?
- Is pricing aligned with value?
For technology businesses, benchmarking should connect product, customer success, finance and operations.
Healthcare and social care
Healthcare and social care organisations use benchmarking for safety, quality, staffing, demand, cost and outcomes.
Typical benchmarks include:
- Staff absence
- Agency use
- Occupancy
- Care hours
- Medication incidents
- Training completion
- Complaint rates
- Family satisfaction
- Staff turnover
- Safeguarding reporting
- Inspection ratings
- Cost per care hour
- Waiting times
- Incident response
- Continuity of care
A care provider might ask:
- Are staffing levels stable?
- Is agency use excessive?
- Are training rates strong?
- Are incident levels in line with expectations?
- Are families satisfied with communication?
- Are care costs sustainable?
- Are quality indicators improving?
- What can be learned from better-performing homes or teams?
In healthcare and care, benchmarking must never be used to justify unsafe practice.
Safety, dignity, safeguarding and professional judgement remain central.
Education and training
Education providers use benchmarking for learner outcomes, funding, quality, attendance, staffing and employer engagement.
Typical benchmarks include:
- Enrolment
- Attendance
- Retention
- Completion
- Achievement
- Progression
- Learner satisfaction
- Employer satisfaction
- Staff utilisation
- Funding per learner
- Course profitability
- Safeguarding training
- Assessment timeliness
- Digital engagement
- Placement completion
An education provider might ask:
- Are completion rates strong?
- Are learners progressing into employment?
- Are courses financially viable?
- Are employers satisfied?
- Is attendance weaker than peers?
- Are support needs increasing?
- Are staff workloads sustainable?
- Which courses should grow, improve or stop?
For education, benchmarking should connect financial sustainability with learner outcomes, quality and safeguarding.
How to carry out benchmarking properly
1. Define the purpose
Start by deciding why benchmarking is being carried out.
Ask:
- What decision will this support?
- What performance area is being reviewed?
- What do we want to improve?
- Who will use the findings?
- What action may follow?
- What level of accuracy is needed?
- What comparison is meaningful?
- What data is available?
- What timescale applies?
- What would make the benchmarking useful?
Benchmarking without a purpose can become data collection without improvement.
2. Choose what to benchmark
Do not benchmark everything.
Choose areas that matter.
These may include:
- Strategic priorities
- Financial performance
- Customer experience
- Operational efficiency
- Quality
- Risk areas
- Board concerns
- High-cost processes
- Underperforming services
- Areas of uncertainty
- Areas with major investment
- Areas where performance varies internally
- Areas where competitors appear stronger
- Areas linked to customer complaints
- Areas linked to risk appetite
The best benchmarking focuses on performance that matters to decisions.
3. Define the measure clearly
A benchmark is only useful if the measure is clear.
For example, “response time” could mean:
- Time to acknowledge an enquiry
- Time to provide a full answer
- Time to resolve an issue
- Time during working hours only
- Time including weekends
- Average time
- Median time
- 90th percentile response time
If definitions differ, comparisons may be misleading.
Clear definitions are essential.
4. Choose the comparison group
The comparison group should be relevant.
Possible comparisons include:
- Competitors
- Peer organisations
- Similar-sized businesses
- Similar locations
- Similar customer groups
- Similar service models
- Similar regulatory environments
- Internal teams
- Historic performance
- Best practice organisations
A poor comparison group can lead to poor conclusions.
For example, comparing a small local charity with a large national charity may be misleading unless differences in scale and purpose are understood.
5. Gather reliable data
Benchmarking needs reliable evidence.
Sources may include:
- Internal management information
- Published accounts
- Industry surveys
- Trade body data
- Government datasets
- Regulator reports
- Customer reviews
- Market research
- Competitor websites
- Mystery shopping
- Internal audit reports
- Operational systems
- CRM data
- Financial systems
- Public performance reports
Check the data for:
- Accuracy
- Completeness
- Timeliness
- Consistency
- Definition
- Source reliability
- Bias
- Comparability
- Sample size
- Context
Bad data creates bad benchmarking.
6. Adjust for context
Context matters.
Performance differences may be caused by:
- Scale
- Geography
- Customer mix
- Service complexity
- Regulation
- Funding
- Age of assets
- Staff skill levels
- Technology
- Product mix
- Market position
- Contract terms
- Seasonality
- Economic conditions
- Risk appetite
A benchmark should not be interpreted mechanically.
A higher cost may be justified if the service is more complex or higher quality.
A lower cost may hide poor outcomes.
7. Identify the gap
Benchmarking should show the gap between current performance and the comparison point.
For example:
- Our debtor days are 52; peer benchmark is 38.
- Our website conversion rate is 1.2%; market benchmark is 2.5%.
- Our staff turnover is 22%; internal best-performing department is 8%.
- Our build cost is £210 per square foot higher than comparable schemes.
- Our complaint resolution time is twice as long as the best-performing team.
The gap should be quantified where possible.
8. Understand the cause
The gap is not the answer.
It is the starting point.
Ask:
- Why does the gap exist?
- Is the benchmark fair?
- Is the data comparable?
- Is the difference caused by process?
- Is it caused by pricing?
- Is it caused by quality?
- Is it caused by customer mix?
- Is it caused by staffing?
- Is it caused by systems?
- Is it caused by management practice?
This is where benchmarking becomes improvement work.
9. Learn from better practice
Where better performance exists, study what enables it.
This may include:
- Better process design
- Better systems
- Better training
- Clearer ownership
- Better data
- Stronger management routines
- Better incentives
- Better communication
- Better supplier arrangements
- Better customer segmentation
- Better pricing
- Stronger leadership
- Better governance
- Better technology
- Better culture
The aim is not to copy blindly.
The aim is to understand what is transferable.
10. Turn findings into action
Benchmarking should lead to improvement.
Possible actions include:
- Set a new target
- Improve a process
- Change pricing
- Invest in systems
- Train staff
- Review staffing levels
- Change supplier arrangements
- Redesign customer service
- Improve reporting
- Change product mix
- Reduce waste
- Improve credit control
- Update the roadmap
- Add a risk to the risk register
- Commission further analysis
A benchmark without action has limited value.
Common benchmarking techniques
Ratio analysis
Ratio analysis compares financial or operational ratios.
Examples include:
- Gross margin
- Net margin
- Revenue per employee
- Debtor days
- Stock turn
- Overhead percentage
- Cost per unit
- Staff cost ratio
- Return on capital
- Liquidity ratios
Ratio analysis is useful because it standardises comparisons.
Peer group comparison
Peer group comparison compares similar organisations.
It is useful for charities, public bodies, professional services, property, education and healthcare.
The peer group must be chosen carefully.
Best practice review
A best practice review studies organisations or teams known to perform well.
It is useful for improvement planning.
Internal performance ranking
Internal ranking compares teams, sites, branches or departments.
It can identify internal good practice.
It should be used carefully to avoid blame or unhealthy competition.
Process mapping comparison
This compares how different teams or organisations carry out the same process.
It helps identify delays, duplication, handover issues and control weaknesses.
Customer experience benchmarking
This compares customer experience across competitors or internal teams.
It may include:
- Mystery shopping
- Response time testing
- Website journey review
- Review analysis
- Customer satisfaction comparison
- Complaint handling review
Digital benchmarking
Digital benchmarking compares online performance.
Examples include:
- Website speed
- Search visibility
- Conversion rate
- Social engagement
- Email performance
- Online reviews
- User journey quality
- Accessibility
Common mistakes in benchmarking
Mistake 1: Comparing against the wrong organisations
If the comparison group is not relevant, the benchmark may mislead.
Choose peers carefully.
Mistake 2: Using inconsistent definitions
Different organisations may define measures differently.
Always check definitions.
Mistake 3: Focusing only on numbers
Numbers show the gap.
They do not explain the cause.
Mistake 4: Copying without understanding
What works elsewhere may not work in your organisation.
Context matters.
Mistake 5: Ignoring quality
Lower cost is not always better.
A cheap service may create poor outcomes, complaints or risk.
Mistake 6: Benchmarking too many things
Too much benchmarking creates noise.
Focus on the measures that matter most.
Mistake 7: Not adjusting for context
Differences in scale, customer mix, geography, regulation and service complexity can affect performance.
Mistake 8: Using old data
Markets and performance change.
Outdated benchmarks may create poor decisions.
Mistake 9: Treating the benchmark as the target
A benchmark is a comparison point.
The target should reflect strategy, customer need, resources and risk appetite.
Mistake 10: Not acting on findings
Benchmarking should lead to improvement.
If no action follows, the exercise has limited value.
Limitations and weaknesses of benchmarking
Benchmarking is useful, but it has limits.
It can oversimplify performance
A single benchmark may not capture quality, complexity, risk or customer experience.
It depends on data quality
Poor or inconsistent data can produce misleading conclusions.
It may encourage copying
Benchmarking should inspire learning, not imitation without thought.
It can ignore strategy
A competitor may perform well because it has a different strategy.
Matching its performance may not fit your objectives.
It can create false pressure
Being below a benchmark does not always mean failure.
There may be valid reasons for the difference.
It can create complacency
Being above a benchmark does not mean performance is excellent.
The benchmark itself may be weak.
It can miss innovation
Benchmarking compares against existing practice.
It may not identify new ways of working that do not yet have benchmarks.
It can become backward-looking
Benchmarks often use historic data.
They should be combined with horizon scanning, forecasting and strategic thinking.
It does not replace judgement
Benchmarking informs decisions.
It does not make them automatically.
Benchmarking compared with other strategic and management tools
Benchmarking and KPIs
KPIs measure performance.
Benchmarking compares performance with a reference point.
Use KPIs to track. Use benchmarking to understand whether the result is good.
Benchmarking and competitor analysis
Competitor analysis examines rivals in detail.
Benchmarking compares specific performance measures or practices.
Use competitor analysis to understand market behaviour. Use benchmarking to compare performance.
Benchmarking and market research
Market research examines customers, competitors, demand and trends.
Benchmarking compares performance within that market.
Use market research for context. Use benchmarking for comparison.
Benchmarking and positioning map
A positioning map shows perceived market position.
Benchmarking can provide evidence for price, quality, service or performance comparisons used in the map.
Benchmarking and SWOT
Benchmarking can provide evidence for strengths and weaknesses.
For example, strong customer satisfaction compared with peers may be a strength. High costs compared with peers may be a weakness.
Benchmarking and Balanced Scorecard
The Balanced Scorecard tracks performance across several perspectives.
Benchmarking can strengthen the scorecard by adding external or peer comparison.
Benchmarking and internal audit
Internal audit provides assurance over controls, governance and risk.
Benchmarking can help internal audit identify unusual performance, high-risk areas or inefficient processes.
Benchmarking and forecasting
Forecasting estimates future performance.
Benchmarking can test whether forecast assumptions are realistic compared with sector or peer evidence.
Benchmarking and roadmapping
A roadmap sets out improvement over time.
Benchmarking can help identify the gap and set milestones for improvement.
Benchmarking and Appreciative Inquiry
Appreciative Inquiry explores what works well.
Benchmarking can help identify high-performing teams or organisations worth studying.
Alternatives and complementary frameworks
Competitor analysis
Use competitor analysis to understand rival strategies, positioning, pricing and strengths.
Market research
Use market research to understand the wider market context.
Customer research
Use customer research to understand customer needs, perception and experience.
KPI dashboard
Use a KPI dashboard to track performance regularly.
Balanced Scorecard
Use the Balanced Scorecard to connect financial and non-financial performance.
Process mapping
Use process mapping to understand why performance differs.
Root cause analysis
Use root cause analysis to investigate why a benchmark gap exists.
Internal audit
Use internal audit to test whether controls and processes are working.
Best practice review
Use best practice review to understand how better performers achieve results.
Continuous improvement
Use continuous improvement methods to turn benchmarking findings into practical improvement.
A practical benchmarking template
A useful benchmarking template should include:
- Benchmarking title
- Purpose
- Decision supported
- Area being benchmarked
- Measure or process
- Definition of the measure
- Current performance
- Comparison group
- Benchmark source
- Benchmark value
- Performance gap
- Context and adjustments
- Possible causes
- Best practice identified
- Risks
- Recommended actions
- Owner
- Target
- Review date
- Link to strategy, risk register or roadmap
Example:
Benchmarking title: Debtor days comparison
Purpose: Improve cash collection and working capital.
Area being benchmarked: Credit control.
Measure: Debtor days.
Definition: Trade debtors divided by annual credit sales, multiplied by 365.
Current performance: 58 days.
Benchmark: Internal target of 40 days and peer expectation of 35 to 45 days.
Gap: Current performance is 18 days above target.
Possible causes: Weak payment terms, slow invoice issue, insufficient credit control follow-up, customer disputes and poor escalation.
Recommended actions:
- Review payment terms.
- Issue invoices within 24 hours.
- Introduce weekly aged debt review.
- Escalate debts over 45 days.
- Track debtor days monthly.
Owner: Finance Manager.
Review date: Monthly.
Questions to ask during benchmarking
Purpose questions
- Why are we benchmarking this area?
- What decision will it support?
- What improvement are we seeking?
- Who will use the findings?
- What action may follow?
- What level of accuracy is needed?
- What would make the benchmark useful?
- Is this a strategic or operational issue?
- How often should it be reviewed?
- How will findings be reported?
Measure questions
- What exactly are we measuring?
- Is the definition clear?
- Is the data accurate?
- Is the data complete?
- Is the measure meaningful?
- Does it reflect quality as well as quantity?
- Can it be compared fairly?
- Is the measure current?
- Is the measure affected by seasonality?
- Does the measure support the decision?
Comparison questions
- Who are we comparing against?
- Are they relevant?
- Are they similar enough?
- Are there differences in scale?
- Are there differences in customer mix?
- Are there differences in geography?
- Are there differences in service complexity?
- Are there differences in strategy?
- Are there differences in regulation?
- Is the comparison fair?
Interpretation questions
- What does the gap show?
- Is the gap material?
- Is the benchmark reliable?
- What might explain the difference?
- Is the difference good or bad?
- Does quality explain higher cost?
- Does low cost hide risk?
- Are there internal examples of better performance?
- What can we learn?
- What should be investigated further?
Action questions
- What should change as a result?
- Should we set a new target?
- Should we improve a process?
- Should we invest in systems?
- Should we train staff?
- Should we review pricing?
- Should we change suppliers?
- Should we update the roadmap?
- Who owns the action?
- When will progress be reviewed?
The best way to think about benchmarking
Benchmarking is not just comparison.
It is structured learning.
A good benchmarking process should be:
- Purpose-led
- Evidence-based
- Clearly defined
- Fairly compared
- Context-aware
- Focused on improvement
- Linked to strategy
- Linked to action
- Reviewed regularly
- Used with judgement
A weak benchmarking process says:
“This is how we compare.”
A strong benchmarking process asks:
“What does the comparison tell us, why does the gap exist, and what should we improve?”
The key question is not simply:
Are we above or below the benchmark?
The better question is:
What can we learn from the benchmark, and what action will improve performance, value or outcomes?
Conclusion: benchmarking turns comparison into practical improvement
Benchmarking remains useful because organisations need context.
A cost, margin, response time, conversion rate, complaint level or productivity figure means more when compared with something relevant.
Used badly, benchmarking becomes a superficial comparison that ignores context and encourages copying.
Used properly, it becomes a practical management tool. It helps organisations understand performance, identify gaps, learn from better practice, set better targets and improve results.
The real value is not in knowing where you rank.
The real value is in understanding what to do next.
A strong benchmarking process helps an organisation move from saying, “How are we doing?” to asking, “How do we compare, what can we learn, and what should we improve?”