Positioning Map:
A Practical Guide to Understanding Market Position, Customer Perception and Competitive Space
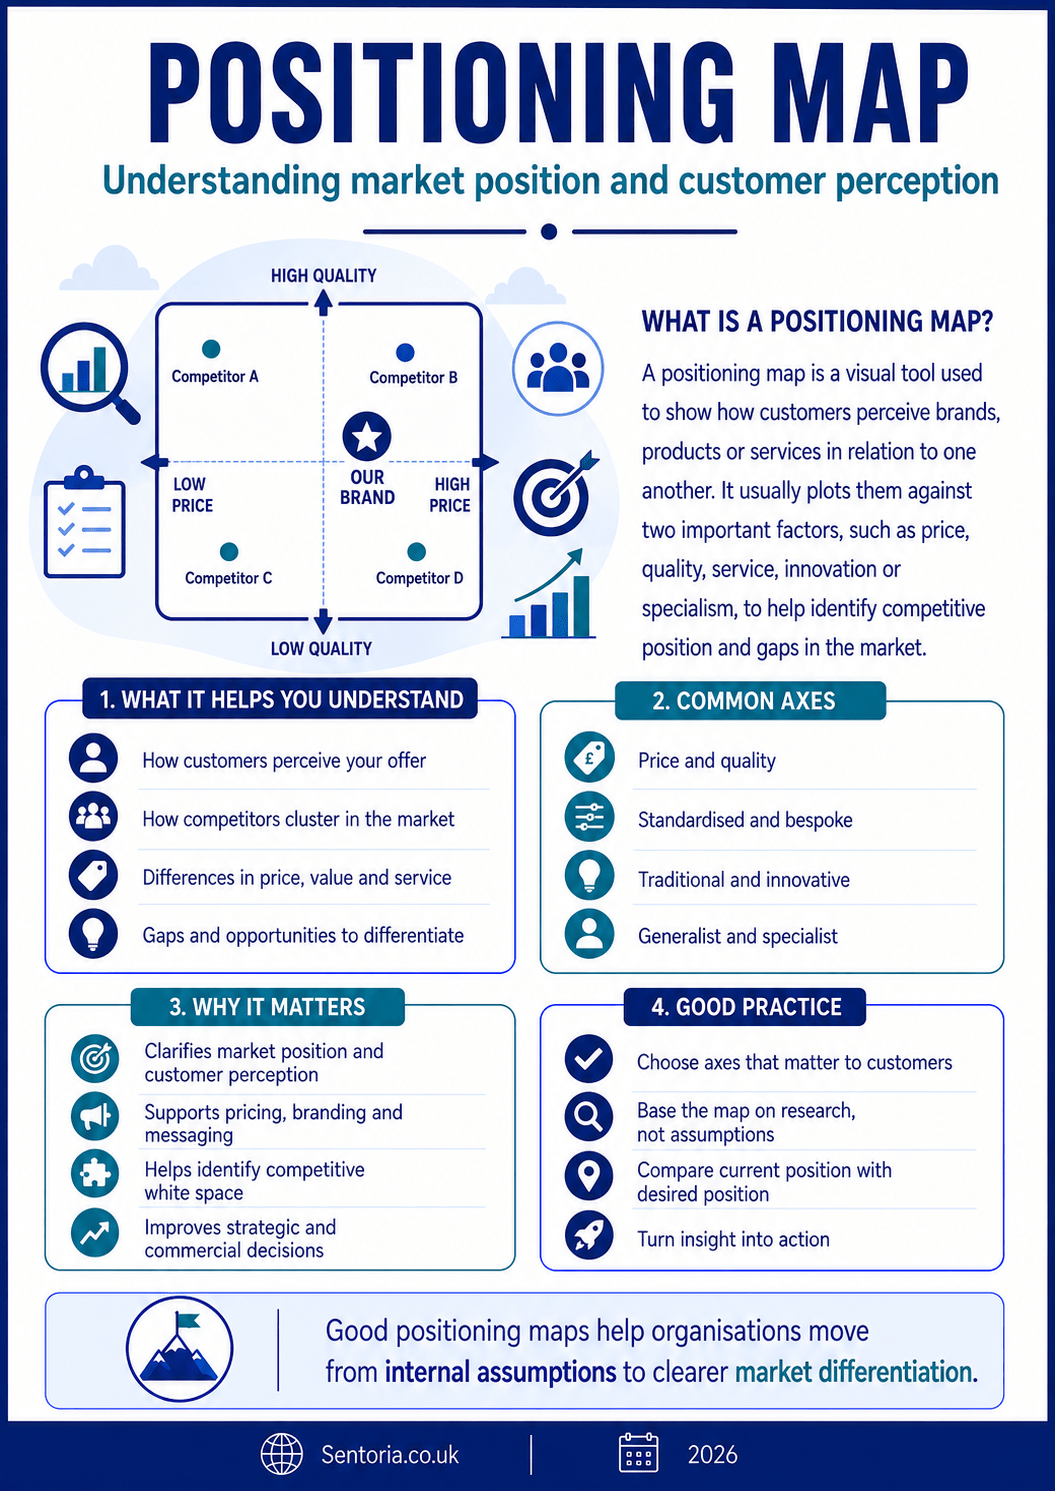
A positioning map, sometimes called a perceptual map, is a visual strategy and marketing tool used to show how customers perceive different brands, products, services or organisations in relation to each other.
At its simplest, a positioning map asks:
Where do customers think we sit in the market, how do we compare with alternatives, and where might there be space to compete more effectively?
That makes it useful for strategy, market research, customer research, competitor analysis, brand positioning, pricing, product development, service design, professional services, retail, ecommerce, technology, property, charity services, public sector planning and board-level decision-making.
Harvard Business Review describes perceptual mapping as a long-used method for understanding how consumers feel about brands relative to competitors and for identifying gaps in the marketplace.
Used properly, a positioning map helps organisations move from vague statements such as “we are different” to a clearer understanding of how they are actually perceived.
What is a positioning map?
A positioning map is a simple visual chart that plots competing brands, products, services or organisations against two or more important customer criteria.
Most commonly, it uses two axes.
For example:
- Low price to high price
- Basic service to premium service
- Traditional to innovative
- Simple to complex
- Mass market to specialist
- Low convenience to high convenience
- Functional to emotional
- Local to national
- Low personal support to high personal support
- Standardised to bespoke
Each competitor is placed on the map according to how customers perceive it.
That phrase is important.
A positioning map is not only about what the organisation believes about itself. It is about how the market perceives it.
A business may think it offers a premium service, but customers may not see it that way.
A charity may think its service is accessible, but beneficiaries may experience it as difficult to navigate.
A professional firm may think it is advisory and strategic, but clients may see it as technical and reactive.
A retailer may believe it is good value, but customers may see it as mid-market or expensive.
A positioning map helps make those perceptions visible.
Positioning map, perceptual map and market map
The terms are often used interchangeably, but there are useful differences.
Positioning map
A positioning map usually shows how an organisation, brand, product or service is positioned in the market.
It may be based on customer perception, management judgement, competitor evidence or a mix of data.
It asks:
Where are we positioned compared with alternatives?
Perceptual map
A perceptual map focuses specifically on customer perception.
It asks:
How do customers perceive us and our competitors?
This is often the stronger form of analysis because it is based on what customers think, not only what managers assume.
Market map
A market map may be broader.
It can show competitors, segments, price points, service levels, geography or market coverage.
It asks:
What does the market landscape look like?
In simple terms:
A positioning map shows market position.
A perceptual map shows perceived position.
A market map shows the wider market landscape.
In practice, many organisations use the terms loosely. The important point is to be clear about what evidence has been used.
History and development of positioning maps
Positioning maps developed from marketing strategy, consumer research, brand positioning and competitive analysis.
As markets became more crowded, organisations needed a way to understand not only what they sold, but how customers saw them compared with alternatives.
Traditional competitor analysis could list products, prices and features, but it did not always show perception.
A positioning map helped solve that problem by turning customer judgement into a visual comparison.
Over time, positioning maps became common in:
- Brand strategy
- Product development
- Marketing planning
- Retail positioning
- Pricing decisions
- Customer research
- Service design
- Market entry decisions
- Competitive strategy
- Portfolio analysis
The method remains popular because it is simple, visual and easy to discuss.
However, modern positioning maps should not rely only on guesswork. They can now be supported by customer surveys, interviews, review analysis, website behaviour, search data, sentiment analysis and market research. One recent study describes perceptual maps as visual diagrams that illustrate where and how brands and competitors are positioned in consumers’ minds.
Why positioning maps matter
Positioning maps matter because customers choose between alternatives.
They rarely judge an organisation in isolation.
They ask, consciously or unconsciously:
- Is this cheaper or more expensive?
- Is this simpler or more comprehensive?
- Is this more local or more national?
- Is this premium or budget?
- Is this specialist or generalist?
- Is this trusted or risky?
- Is this modern or traditional?
- Is this faster or more personal?
- Is this better value?
- Is this right for someone like me?
A positioning map helps organisations understand those comparisons.
It supports:
- Clearer market positioning
- Better customer understanding
- Better competitor analysis
- Better pricing decisions
- Stronger value propositions
- More focused marketing messages
- Better product and service development
- Identification of market gaps
- Better strategic choices
- Better brand differentiation
- Stronger sales conversations
- More useful board discussion
- Better launch planning
- Reduced assumption-led decision-making
- Better alignment between internal ambition and external perception
The value is not in drawing a neat chart.
The value is in discussing what the chart reveals.
When to use a positioning map
A positioning map is useful whenever an organisation needs to understand where it sits in a market.
Good uses include:
- Reviewing brand position
- Launching a new product
- Launching a new service
- Entering a new market
- Repositioning an organisation
- Reviewing pricing
- Understanding competitors
- Improving marketing messages
- Testing customer perception
- Identifying market gaps
- Reviewing product portfolio
- Developing a value proposition
- Preparing a business plan
- Supporting investment appraisal
- Planning a website or campaign
- Evaluating customer segments
- Considering a new location
- Supporting board strategy
- Testing a merger or acquisition
- Reviewing service accessibility
It is especially useful where:
- The market is crowded.
- Customers have several alternatives.
- The organisation is unclear how it is perceived.
- Competitors are becoming more active.
- Pricing is under pressure.
- The organisation wants to differentiate.
- Growth has slowed.
- A new proposition is being considered.
- Brand perception does not match internal ambition.
- There is disagreement about strategy.
It is less useful where the axes are badly chosen or the map is created only from internal opinion.
What should the axes show?
The axes are the most important part of a positioning map.
If the axes do not matter to customers, the map will not be useful.
Common axis pairs include:
Price and quality
This is one of the most common positioning maps.
It asks:
Are we seen as low-cost, mid-market, premium or poor value?
It can be useful for retail, professional services, manufacturing, software, property and consumer markets.
However, it can be too simplistic.
High price does not always mean high quality, and customers may define quality differently from the organisation.
Price and service level
This is useful where support, advice or personal service matters.
For example:
- Budget self-service
- Low-cost assisted service
- Premium personal service
- High-cost but low-service providers
This can be useful in professional services, hospitality, software, property management and healthcare.
Specialist and generalist
This map asks:
Are we seen as a broad provider or a specialist provider?
It is useful for professional services, consultants, healthcare, training providers, charities, technology firms and manufacturers.
A specialist position may support premium pricing and stronger differentiation, but may limit market size.
Traditional and innovative
This map asks:
Are we seen as established and conventional, or modern and innovative?
It can be useful for technology, banking, professional services, education, retail and public services.
The important point is not that innovative is always better. Some customers value tradition, trust and stability.
Convenience and personalisation
This map asks:
Do customers value speed and ease, or tailored service and personal support?
Some markets reward convenience.
Others reward reassurance and customisation.
Trying to provide both may be possible, but often requires careful design.
Functional and emotional value
This map asks:
Are customers buying practical utility, emotional reassurance, identity, status or trust?
It is useful for brands, charities, education, healthcare, property, luxury goods and professional services.
Local and national
This map asks:
Are customers choosing local knowledge, personal connection and proximity, or national scale, systems and brand recognition?
This is useful for accountancy firms, estate agents, trades, hospitality, care providers, charities and professional services.
Low risk and high risk
This map asks:
How much trust, security or reassurance does the customer need before buying?
This can be useful for financial services, healthcare, professional advice, construction, technology and high-value purchases.
Types of positioning map
1. Brand positioning map
A brand positioning map shows how brands are perceived in relation to each other.
It may use axes such as:
- Traditional to modern
- Budget to premium
- Mass market to specialist
- Functional to emotional
- Local to national
- Safe to adventurous
This is useful for brand strategy and marketing.
2. Product positioning map
A product positioning map compares products.
It may use axes such as:
- Low price to high price
- Few features to many features
- Basic to advanced
- Low durability to high durability
- Low convenience to high convenience
This is useful for product development and range planning.
3. Service positioning map
A service positioning map compares service offerings.
It may use axes such as:
- Self-service to fully supported
- Standardised to bespoke
- Reactive to proactive
- Transactional to advisory
- Fast to thorough
This is useful for professional services, healthcare, education, charities and public services.
4. Competitor positioning map
A competitor positioning map compares the organisation with competitors.
It may show:
- Where competitors cluster
- Where gaps may exist
- Where the organisation is too similar
- Where differentiation is credible
- Where price or value is under pressure
This is useful for strategy and market entry.
5. Customer segment positioning map
A customer segment positioning map shows how different customer groups perceive the market.
One segment may see the organisation as premium.
Another may see it as expensive but unclear.
Another may not know it exists.
This is useful because different segments may require different propositions.
6. Portfolio positioning map
A portfolio positioning map shows where different products or services sit within one organisation’s offer.
It may help identify:
- Overlap
- Cannibalisation
- Gaps
- Confusing propositions
- Opportunities to simplify
- Premium or entry-level options
- Cross-selling potential
This is useful for organisations with several products, services or brands.
Positioning maps in different industries
SMEs and owner-managed businesses
For SMEs, a positioning map can help clarify how the business competes.
Many SMEs say they compete on service, quality and relationships. That may be true, but it needs to be tested against customer perception and competitor evidence.
Typical SME positioning questions include:
- Are we budget, mid-market or premium?
- Are we local, regional or specialist?
- Are we seen as responsive?
- Are we seen as trusted?
- Are we too similar to competitors?
- Do customers understand our difference?
- Are we charging consistently with our position?
- Are we targeting the right customers?
- Is our marketing aligned with our position?
- Is our service experience reinforcing our intended position?
For SMEs, a simple map can create useful clarity.
It can show whether the business is trying to serve too many customer types or whether its pricing, messaging and service model are misaligned.
Manufacturing
Manufacturers can use positioning maps to compare products, technical capability, price, quality, reliability and service.
Useful axes include:
- Standardised to bespoke
- Low price to premium price
- Short lead time to long lead time
- Basic quality to high precision
- Low technical support to high technical support
- Commodity to specialist
- Low volume to high volume
- Local supplier to global supplier
A manufacturer might use a positioning map to ask:
- Are we competing on price or technical value?
- Are we seen as specialist or generalist?
- Are customers paying for quality, speed or support?
- Are competitors occupying the same space?
- Is there a gap for premium specialist supply?
- Are we underpricing a high-value position?
- Do our operations support our intended position?
For manufacturing, positioning should connect to production capability, margin, quality and customer requirements.
Retail and ecommerce
Retail and ecommerce businesses can use positioning maps for pricing, product range, brand perception, convenience and customer experience.
Useful axes include:
- Budget to premium
- Functional to lifestyle
- Fast delivery to curated experience
- Broad range to specialist range
- Low support to high advice
- Trend-led to classic
- Low trust to high trust
- Discount-led to value-led
A retailer might ask:
- Are we perceived as good value or cheap?
- Are we differentiated from marketplace competitors?
- Are we premium enough to support our margins?
- Are we too broad?
- Are customers buying convenience or curation?
- Are reviews supporting our intended position?
- Does our website reinforce the position?
For ecommerce, positioning maps should be supported by customer behaviour, reviews, pricing data and competitor analysis.
Professional services
Professional services firms can use positioning maps to clarify how clients perceive their service.
Useful axes include:
- Compliance to advisory
- Reactive to proactive
- Low-cost to premium
- Generalist to specialist
- Technical to commercial
- Transactional to relationship-led
- Local to national
- Standardised to bespoke
For accountants, solicitors, consultants, architects and advisers, a positioning map might ask:
- Are we seen as technical experts or commercial advisers?
- Are we proactive enough to justify premium pricing?
- Are we specialist or generalist?
- Are we competing with low-cost providers unnecessarily?
- Do clients understand our higher-value services?
- Does our website match our intended position?
- Are competitors claiming the same space?
Professional services positioning often fails because firms describe themselves using similar language.
A positioning map helps reveal whether the difference is real, valued and visible.
Charities and voluntary organisations
Charities can use positioning maps to understand their place among beneficiaries, funders, commissioners, donors and partners.
Useful axes include:
- Preventative to crisis support
- Local to national
- Specialist to broad support
- Professional-led to community-led
- Low visibility to high visibility
- Direct delivery to influencing
- Traditional fundraising to social enterprise
- Service provision to system change
A charity might ask:
- How do funders see us compared with others?
- Are we seen as specialist or general community support?
- Are beneficiaries clear about what we do?
- Are we positioned around impact clearly enough?
- Are we too dependent on a crowded funding area?
- Is there an unmet need we are well placed to serve?
- Does our position support long-term sustainability?
For charities, the map should not be used only for marketing. It can support strategy, funding, service design and partnership planning.
Public sector and local government
Public bodies can use positioning maps in service design, consultation, commissioning and policy planning.
Useful axes include:
- Universal to targeted
- Digital to face-to-face
- Preventative to reactive
- Centralised to local
- Standardised to personalised
- Low-cost to high-support
- Statutory minimum to enhanced provision
- Direct delivery to partner-led delivery
A public body might ask:
- Where does this service sit compared with alternatives?
- Is the service accessible to the right people?
- Are residents clear about what is offered?
- Are we over-investing in one model?
- Are partners better placed to deliver some elements?
- Where is there unmet need?
- How does the service position align with statutory duties and public value?
For public services, positioning maps should be used carefully. The aim is not commercial competition alone. It is clarity about need, access, value and delivery model.
Property and construction
Property and construction organisations can use positioning maps for developments, assets, occupier markets and regeneration schemes.
Useful axes include:
- Budget to premium
- Residential to commercial
- Flexible to fixed space
- Traditional to modern
- Local convenience to destination
- Low amenity to high amenity
- Heritage-led to new-build
- Affordable to aspirational
A property business might ask:
- How is this site positioned compared with alternatives?
- What occupier segment are we targeting?
- Are we competing on price, location, flexibility or quality?
- Is there a gap for flexible workspace?
- Is the scheme positioned clearly for planning and community engagement?
- Does the specification match the intended position?
- Are rental expectations aligned with market perception?
For property and construction, positioning should connect to viability, design, planning, leasing, stakeholder engagement and long-term asset value.
Technology and software
Technology businesses can use positioning maps for product strategy, feature positioning, pricing and customer segments.
Useful axes include:
- Simple to advanced
- Low-cost to enterprise
- Self-service to managed support
- General tool to specialist tool
- Low integration to high integration
- Ease of use to depth of functionality
- Startup-friendly to enterprise-grade
- Fast implementation to highly customised
A software business might ask:
- Are we trying to serve too many customer segments?
- Are we simple enough for small customers?
- Are we powerful enough for enterprise customers?
- Are competitors more clearly positioned?
- Is our pricing aligned with perceived value?
- Are we differentiated by usability, features, support or outcomes?
- Does the product roadmap support our intended position?
For technology businesses, positioning maps should be linked to customer research, churn analysis, competitor analysis and product roadmap decisions.
Healthcare and social care
Healthcare and social care organisations can use positioning maps for service models, accessibility, quality, specialism and patient or family experience.
Useful axes include:
- General support to specialist support
- Reactive care to preventative care
- Low personalisation to high personalisation
- Clinical to holistic
- Institutional to home-like
- Low family communication to high family communication
- Digital access to face-to-face support
- Low-cost to enhanced service
A care provider might ask:
- How do families perceive our service?
- Are we differentiated by quality, specialism or communication?
- Are we accessible to the right people?
- Are we positioned clearly against other providers?
- Does our staffing and care model support our intended position?
- Does our reputation match our claims?
- What service gaps exist locally?
In healthcare and care, positioning maps must be used alongside safety, safeguarding, clinical governance and regulatory standards.
Education and training
Education providers can use positioning maps for courses, learner segments, employer needs and market positioning.
Useful axes include:
- Academic to vocational
- Entry-level to advanced
- Online to in-person
- Low support to high support
- General to specialist
- Low-cost to premium
- Learner-led to employer-led
- Flexible to structured
An education provider might ask:
- Where do our courses sit compared with alternatives?
- Are we serving learners or employers most clearly?
- Are we differentiated by support, outcomes or flexibility?
- Are we too similar to competitors?
- Are there unmet skills needs?
- Does pricing or funding match the position?
- Does the learner experience support our claimed position?
For education, positioning should connect to learner outcomes, employer demand, funding, quality and safeguarding.
How to create a positioning map properly
1. Define the purpose
Start by deciding why the map is being created.
Ask:
- What decision will this support?
- Are we reviewing a brand, product, service or organisation?
- Are we trying to understand current position or desired position?
- Are we testing customer perception?
- Are we exploring a new market?
- Are we reviewing competitors?
- Are we looking for gaps?
- Who will use the map?
- What action might follow?
- What would make the map useful?
A positioning map without a clear purpose can become a workshop exercise rather than a decision tool.
2. Define the market
Be clear about the market being mapped.
For example:
Weak definition:
Accountancy firms.
Stronger definition:
Accountancy firms serving owner-managed businesses in West Yorkshire with turnover between £500,000 and £10 million.
Weak definition:
Training providers.
Stronger definition:
Providers of vocational training for adults seeking work in digital and business administration roles within West Yorkshire.
A clear market definition prevents irrelevant comparisons.
3. Identify the competitors or alternatives
List the organisations, brands, products or services customers might compare.
Include:
- Direct competitors
- Indirect competitors
- Substitutes
- DIY options
- In-house solutions
- Low-cost alternatives
- Premium alternatives
- New entrants
- Digital alternatives
- Local alternatives
Customers often compare more broadly than organisations expect.
For example, a professional services firm may not only compete with other firms. It may compete with software, templates, in-house staff or doing nothing.
4. Choose the axes
Choose two dimensions that matter to customers.
Good axes should be:
- Relevant to customer choice
- Easy to understand
- Based on evidence
- Meaningfully different from each other
- Useful for strategy
- Not simply flattering to the organisation
- Capable of separating competitors
- Linked to the decision being made
Poor axes create poor maps.
For example, mapping “quality” against “value” may be too vague unless customers have clearly defined what those words mean.
5. Gather evidence
A positioning map should be based on evidence where possible.
Useful evidence includes:
- Customer interviews
- Customer surveys
- Review analysis
- Competitor websites
- Pricing data
- Mystery shopping
- Sales feedback
- Lost customer research
- Website analytics
- Search data
- Public ratings
- Social media commentary
- Product comparisons
- Customer support data
- Market reports
Management judgement can be used, but it should be labelled as judgement.
A map based only on internal opinion should not be treated as fact.
6. Plot the competitors
Place each competitor on the map.
This should be done carefully.
Ask:
- What evidence supports the position?
- Would customers agree?
- Is this current or historic perception?
- Is this true for all segments?
- Are there regional differences?
- Are there different perceptions by customer type?
- Are we plotting reality or aspiration?
- Are competitors being treated fairly?
- Is there bias?
- Are we using consistent criteria?
Where evidence is uncertain, note that uncertainty.
7. Plot the organisation
Place your own organisation on the map.
Be honest.
The current position may not match the desired position.
For example:
- You may want to be premium, but customers see you as mid-market.
- You may want to be specialist, but the website looks generalist.
- You may want to be innovative, but customers see you as traditional.
- You may want to be advisory, but clients see you as compliance-led.
- You may want to be accessible, but users find the process confusing.
This gap can be extremely useful.
8. Interpret the map
The map should be discussed.
Ask:
- Where are competitors clustered?
- Where is there white space?
- Is the white space attractive?
- Are we differentiated?
- Are we too close to stronger competitors?
- Does our price match our position?
- Does our messaging match our position?
- Does customer experience support our position?
- What position do we want?
- What would need to change?
The map should not be accepted uncritically.
White space is not always opportunity. Sometimes the space is empty because customers do not want it.
9. Decide the strategic implication
A positioning map should lead to a decision.
Possible decisions include:
- Maintain current position
- Reposition the brand
- Change pricing
- Change messaging
- Improve service level
- Target a different segment
- Drop an unclear product
- Create a premium offer
- Create an entry-level offer
- Simplify the proposition
- Improve customer experience
- Invest in capability
- Avoid a crowded market
- Enter an underserved space
- Gather more evidence
A positioning map is only useful if it affects strategy.
10. Review regularly
Markets change.
Competitors move.
Customer expectations shift.
Your own position changes.
Review the map when:
- A new competitor enters
- Pricing changes
- Customer feedback changes
- A new product or service launches
- The organisation rebrands
- A new market is entered
- Sales performance changes
- Customer segments change
- Market research is updated
- Strategy is reviewed
A positioning map is a snapshot, not a permanent truth.
Common positioning map techniques
Two-axis positioning map
This is the standard format.
It plots competitors on two dimensions, such as price and service level.
It is simple and easy to explain.
Perceptual map from customer survey
This uses customer research to plot how customers perceive competitors.
It is stronger than internal judgement because it is evidence-based.
Price-benefit map
A price-benefit map compares price with perceived customer benefit.
Harvard Business Review describes price-benefit positioning maps as a way to see through customers’ eyes how a product compares with competitors in a market.
This is useful for pricing and value strategy.
Centrality-distinctiveness map
A centrality-distinctiveness map compares how central a brand is to the category with how distinctive it is.
Harvard Business Review’s centrality-distinctiveness approach argues that brands can be mapped by how representative they are of their category and how strongly they stand out from competitors.
This is useful for brand strategy.
Segment-specific positioning map
This creates different maps for different customer segments.
It is useful where one map hides important differences.
Portfolio positioning map
This maps the organisation’s own products or services.
It is useful for range planning and avoiding internal overlap.
Desired versus current position map
This plots both the current position and desired future position.
It is useful for repositioning work.
Common mistakes in positioning maps
Mistake 1: Choosing weak axes
If the axes do not matter to customers, the map will not help.
The axes should reflect real decision criteria.
Mistake 2: Using internal opinion as fact
Management perception is not the same as customer perception.
Use customer research where possible.
Mistake 3: Mapping aspiration rather than reality
Do not plot where the organisation wants to be and pretend it is the current position.
Show current position honestly.
Mistake 4: Ignoring customer segments
Different customers may perceive the market differently.
One map may not be enough.
Mistake 5: Assuming white space means opportunity
Empty space may indicate unmet need.
It may also indicate no demand.
Further market research is needed.
Mistake 6: Using vague labels
Labels such as “quality” and “value” can be too broad.
Define what customers mean by them.
Mistake 7: Comparing irrelevant competitors
Only include alternatives customers might realistically consider.
Mistake 8: Not linking the map to action
A positioning map should influence decisions about pricing, messaging, product, service, customer segment or strategy.
Mistake 9: Treating the map as permanent
Markets and perceptions change.
The map should be reviewed.
Mistake 10: Overcrowding the map
Too many competitors can make the map unreadable.
Group competitors or create separate maps if needed.
Limitations and weaknesses of positioning maps
Positioning maps are useful, but they have limits.
They simplify complex markets
A two-axis map cannot capture everything.
Customers may consider several factors at once.
They depend on axis choice
Different axes can create very different maps.
The choice of axes strongly affects the conclusion.
They can be subjective
Unless based on strong research, positioning maps may reflect internal bias.
They can overstate gaps
White space may look attractive but may not represent demand.
They may hide segment differences
A position that is true for one segment may not be true for another.
They may ignore operational reality
A desirable position may not be achievable without changes in capability, cost, systems, people or service design.
They may focus too much on competitors
Competitor comparison matters, but positioning should also be grounded in customer need and organisational capability.
They do not replace strategy
A positioning map informs strategy.
It does not decide strategy by itself.
Positioning map compared with other strategic and management tools
Positioning map and market research
Market research gathers evidence about customers, competitors, demand and trends.
A positioning map visualises part of that evidence.
Use market research to build the map properly.
Positioning map and customer research
Customer research explains needs, behaviours and perceptions.
A perceptual positioning map should be based on customer research wherever possible.
Positioning map and competitor analysis
Competitor analysis examines alternatives.
A positioning map summarises competitive comparison visually.
Use competitor analysis for detail and positioning maps for clarity.
Positioning map and Value Proposition Canvas
The Value Proposition Canvas connects customer jobs, pains and gains with the offer.
A positioning map shows how that offer compares with alternatives.
Positioning map and Business Model Canvas
The Business Model Canvas explains how the organisation creates, delivers and captures value.
A positioning map helps test whether the chosen market position supports that model.
Positioning map and SWOT
SWOT identifies strengths, weaknesses, opportunities and threats.
A positioning map may reveal opportunities in market gaps and threats from competitor clusters.
Positioning map and Blue Ocean Strategy
Blue Ocean Strategy seeks uncontested market space.
A positioning map may help identify crowded areas and possible new spaces, but white space must still be tested for demand.
Positioning map and Porter’s Five Forces
Porter’s Five Forces examines industry attractiveness and competitive pressure.
A positioning map looks at relative positioning within that competitive environment.
Positioning map and pricing strategy
Positioning and pricing are closely linked.
If the organisation wants to be premium, the customer experience, quality, trust and communication must justify that position.
Positioning map and roadmapping
A positioning map may show where the organisation wants to move.
A roadmap then shows the phases, milestones and actions needed to get there.
Alternatives and complementary frameworks
Competitor analysis
Use competitor analysis to understand competitor strengths, weaknesses, pricing, positioning and customer feedback.
Customer research
Use customer research to understand how customers perceive value, alternatives and choice.
Market research
Use market research to understand the wider market and whether a position is attractive.
Value Proposition Canvas
Use the Value Proposition Canvas to test whether the offer fits customer needs.
Business Model Canvas
Use the Business Model Canvas to test whether the intended position supports a viable business model.
Blue Ocean Strategy
Use Blue Ocean Strategy to challenge market assumptions and explore new value curves.
Brand positioning statement
Use a positioning statement to define the target customer, need, offer, difference and reason to believe.
Customer segmentation
Use segmentation to understand whether different groups need different positioning.
Pricing analysis
Use pricing analysis to test whether price supports or undermines the intended position.
A practical positioning map template
A useful positioning map template should include:
- Map title
- Purpose
- Decision supported
- Market definition
- Customer segment
- Competitors included
- Alternatives included
- Axis one
- Axis two
- Evidence source
- Current organisation position
- Desired organisation position
- Competitor positions
- White space identified
- Customer needs linked to the map
- Strategic implications
- Risks
- Recommended actions
- Owner
- Review date
Example:
Map title: Positioning map for monthly financial advisory services
Purpose: Understand where a proposed advisory service sits compared with local accountancy and outsourced finance alternatives.
Market definition: Owner-managed businesses in West Yorkshire with turnover between £500,000 and £10 million.
Axis one: Compliance-led to advisory-led.
Axis two: Low-touch self-service to high-touch personal support.
Competitors included: Local accountancy firms, cloud bookkeeping providers, outsourced FD providers and software-led reporting tools.
Current position: Strong on compliance and personal relationship, but not clearly perceived as advisory-led.
Desired position: Advisory-led and high-touch, with plain-English management information and cash flow support.
Insight: The market contains low-cost compliance providers and higher-cost outsourced FD providers, but there may be space for a practical monthly advisory service aimed at SMEs that need better information but are not ready for a full-time FD.
Recommended actions:
- Interview existing clients.
- Pilot the service with five clients.
- Build a clear advisory service page.
- Create pricing tiers.
- Review whether clients perceive the service as proactive and valuable.
Owner: Managing Director.
Questions to ask when creating a positioning map
Purpose questions
- What decision will this map support?
- Are we mapping a brand, product, service or organisation?
- Are we mapping current position or desired position?
- Who will use the map?
- What action may follow?
- What market are we considering?
- What customer segment matters?
- What evidence do we need?
- What assumptions are we testing?
- What would make the map useful?
Customer questions
- How do customers choose?
- What attributes matter most?
- What do customers value?
- What do customers compare?
- What alternatives do customers consider?
- What creates trust?
- What creates hesitation?
- What does premium mean to customers?
- What does value mean to customers?
- Do different segments perceive us differently?
Competitor questions
- Who are the real competitors?
- What substitutes exist?
- How are competitors positioned?
- What do competitors claim?
- What do customers praise about competitors?
- What do customers criticise?
- Where are competitors clustered?
- Where are competitors weak?
- Which competitors are moving position?
- Which competitors are most relevant?
Axis questions
- Do these axes matter to customers?
- Are the axes easy to understand?
- Are they distinct from each other?
- Do they separate competitors meaningfully?
- Are they based on evidence?
- Are they too vague?
- Are they biased towards our preferred conclusion?
- Would another axis pair be more useful?
- Should we create more than one map?
- What would customers say about these dimensions?
Interpretation questions
- Where are we positioned now?
- Where do we want to be?
- Where are competitors clustered?
- Is there white space?
- Is the white space attractive?
- What evidence supports the opportunity?
- Are we differentiated?
- Are we too close to stronger competitors?
- Does our pricing fit our position?
- Does our customer experience fit our position?
Action questions
- What should change as a result?
- Should we reposition?
- Should we change pricing?
- Should we change marketing messages?
- Should we target a different segment?
- Should we change the service offer?
- Should we improve customer experience?
- Should we gather more evidence?
- Who owns the action?
- When should the map be reviewed?
The best way to think about a positioning map
A positioning map is not just a marketing diagram.
It is a visual test of market perception.
A good positioning map should be:
- Clear
- Evidence-based
- Customer-led
- Competitor-aware
- Properly scoped
- Based on meaningful axes
- Honest about current position
- Useful for decision-making
- Linked to action
- Reviewed regularly
A weak positioning map says:
“This is where we think we sit.”
A strong positioning map asks:
“Where do customers think we sit, how do we compare with alternatives, and what should we do about it?”
The key question is not simply:
Where are we on the map?
The better question is:
Does our current position give customers a clear, valued and credible reason to choose us?
Conclusion: positioning maps turn market perception into strategic clarity
Positioning maps remain useful because markets are crowded, customers compare alternatives, and organisations are not always perceived as they intend.
An organisation may believe it is premium, specialist, trusted, innovative, local, accessible or good value. The market may agree, disagree or not notice.
Used badly, a positioning map becomes a neat diagram based on internal assumptions.
Used properly, it becomes a practical strategy tool. It helps organisations understand customer perception, compare competitors, identify gaps, test pricing, sharpen messaging and make better decisions about where to compete.
The real value is not in plotting dots on a chart.
The real value is in understanding what those dots reveal.
A strong positioning map helps an organisation move from saying, “We know what makes us different,” to asking, “Do customers see that difference, do they value it, and is it strong enough to shape their choice?”