Forecasting:
A Practical Guide to Making Better Predictions, Plans and Decisions
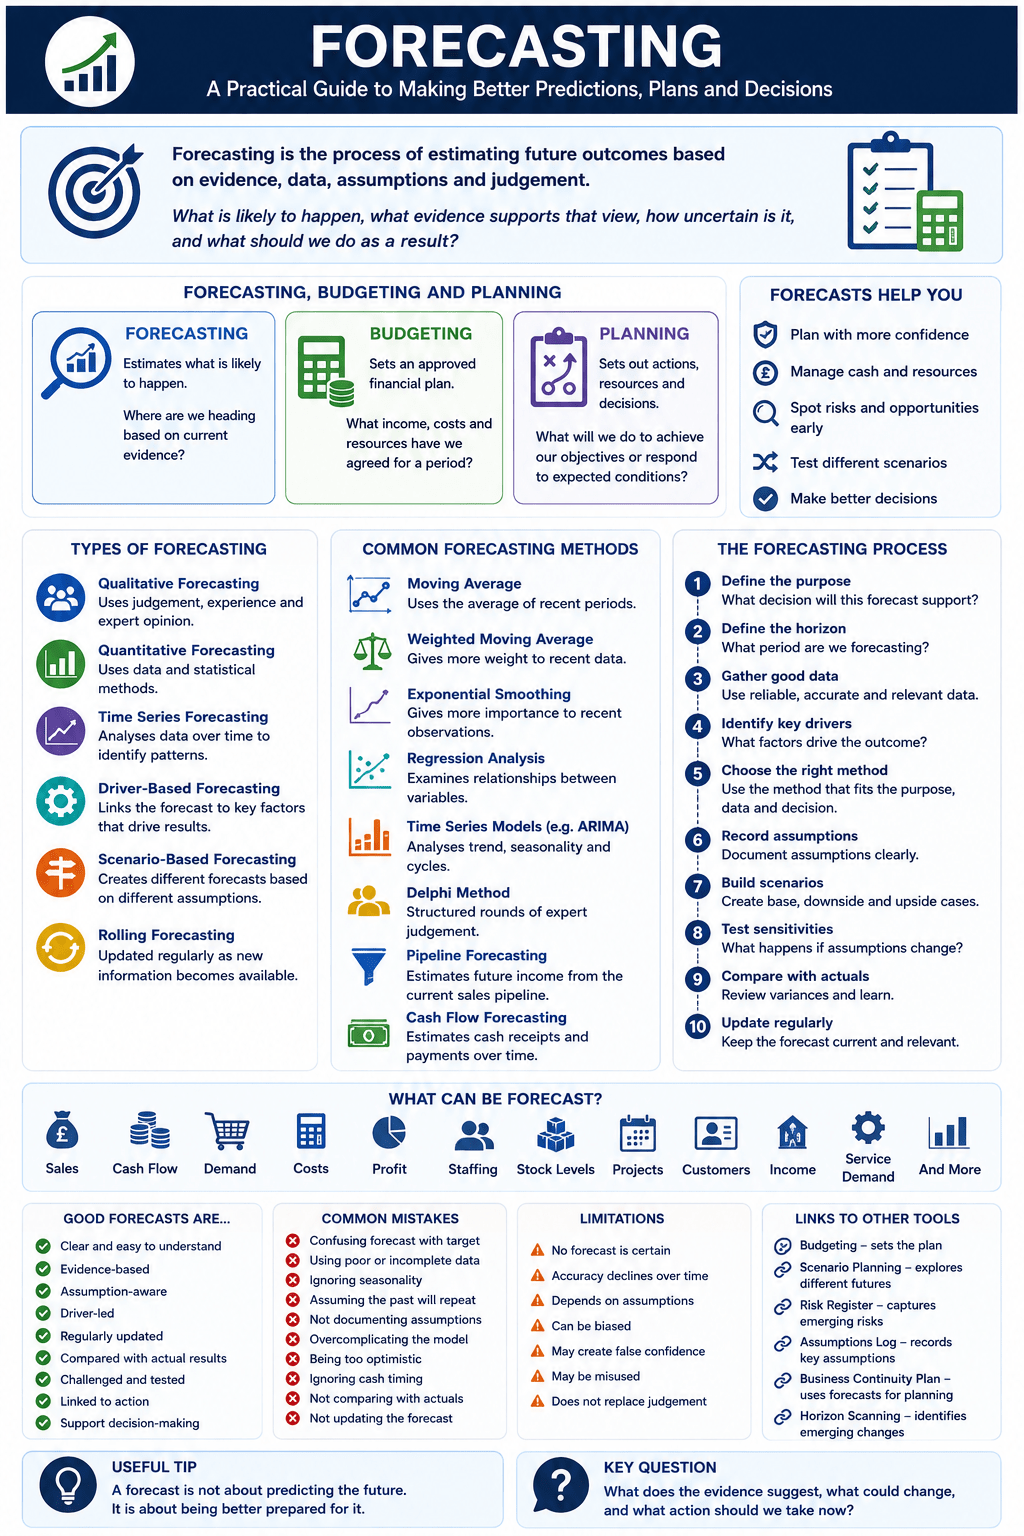
Forecasting is a planning tool used to estimate what may happen in the future based on evidence, data, assumptions, trends and judgement.
At its simplest, forecasting asks:
What is likely to happen, what evidence supports that view, how uncertain is it, and what should we do as a result?
That makes it useful for business planning, cash flow management, sales planning, budgeting, project management, charity governance, public sector services, manufacturing, retail, technology, property, healthcare, education and strategic decision-making.
IBM describes forecasting as a method of predicting a future event or condition by analysing patterns and trends in previous and current data.
Used properly, forecasting does not pretend to know the future. It helps organisations make better decisions under uncertainty.
What is forecasting?
Forecasting is the process of estimating future outcomes.
Those outcomes may include:
- Sales
- Cash flow
- Demand
- Costs
- Profit
- Staffing needs
- Stock levels
- Project completion dates
- Customer behaviour
- Funding income
- Service demand
- Inflation
- Interest rates
- Website traffic
- Production volumes
- Energy usage
- Rental income
- Maintenance costs
- Learner numbers
- Care demand
A forecast is not the same as a target.
A target is what the organisation wants to achieve.
A forecast is what the organisation currently expects to happen.
That distinction matters.
For example:
Target: Increase monthly sales to £100,000.
Forecast: Based on current orders, enquiry levels and conversion rates, monthly sales are expected to reach £82,000.
The target may be useful for ambition. The forecast is useful for planning.
Good management needs both.
Forecasting, budgeting and planning
Forecasting is often confused with budgeting and planning.
They are connected, but they are not the same.
Forecasting
Forecasting estimates what is likely to happen.
It asks:
Where are we heading based on current evidence?
Budgeting
Budgeting sets an approved financial plan.
It asks:
What income, costs and resources have we agreed for a period?
Planning
Planning sets out actions, resources and decisions.
It asks:
What will we do to achieve our objectives or respond to expected conditions?
In simple terms:
The forecast shows what may happen.
The budget shows what has been approved.
The plan shows what action will be taken.
A forecast can show that the budget is no longer realistic. A plan can then be adjusted.
History and development of forecasting
Forecasting has always been part of human decision-making. Farmers observed seasons, merchants judged demand, governments estimated tax income, and businesses tried to predict sales, costs and cash requirements.
Modern forecasting developed as organisations collected more data and statistical techniques became more widely used.
Early forecasting often relied heavily on judgement, experience and simple trend observation. Over time, quantitative methods became more common, particularly as businesses gathered historical sales, economic, production, stock and financial data.
Forecasting now includes a wide range of methods, from simple moving averages to regression models, time series analysis, machine learning, scenario-based forecasting and expert judgement.
Investopedia describes business forecasting as using historical data to make informed predictions about future outcomes, and notes that forecasting is used across business and government for planning and adaptation. It also distinguishes between qualitative methods, based on expert opinion and judgement, and quantitative methods, based on data and statistical techniques.
Forecasting has also become more important because organisations operate in increasingly complex environments. Technology, regulation, customer behaviour, supply chains, inflation, interest rates, funding, energy costs and workforce availability can all change quickly.
The result is simple:
Organisations need forecasts, but they also need to understand the limits of those forecasts.
The main types of forecasting
1. Qualitative forecasting
Qualitative forecasting uses judgement, experience, expert opinion and market insight.
It is useful when:
- Historical data is limited.
- A new product or service is being launched.
- The market is changing quickly.
- Expert knowledge matters.
- Customer behaviour is uncertain.
- There is no reliable data history.
- External events may change the pattern.
- Strategic judgement is required.
Examples include:
- Expert panels
- Management estimates
- Customer surveys
- Sales team input
- Market research
- Delphi method
- Scenario workshops
- Consultant judgement
- Supplier intelligence
- Stakeholder interviews
Qualitative forecasting is useful, but it can be biased.
People may be too optimistic. Sales teams may overstate pipeline. Managers may understate risk. Experts may anchor on past experience. Boards may prefer forecasts that support existing plans.
For that reason, qualitative forecasts should be documented, challenged and tested.
2. Quantitative forecasting
Quantitative forecasting uses data, numbers and statistical methods.
It is useful when:
- Historical data exists.
- Patterns can be analysed.
- The past is relevant to the future.
- Volumes are large enough to produce trends.
- Seasonality matters.
- Forecasts need regular updating.
- Bias needs measurement.
- Accuracy needs tracking.
Examples include:
- Moving averages
- Weighted moving averages
- Exponential smoothing
- Time series analysis
- Regression analysis
- ARIMA models
- Econometric models
- Machine learning models
- Demand modelling
- Driver-based financial models
Quantitative methods can be powerful, but they are not perfect.
They depend on data quality, assumptions and whether historic relationships remain relevant.
Investopedia notes that quantitative forecasting relies on statistical techniques, while qualitative forecasting uses expert opinions and market insights. It also cautions that forecasting can be inaccurate because of unforeseen variables and changing conditions.
3. Time series forecasting
Time series forecasting uses data collected over time.
Examples include:
- Monthly sales
- Weekly website visits
- Daily cash receipts
- Quarterly service demand
- Annual maintenance costs
- Hourly energy usage
- Seasonal stock demand
- Rent collection by month
- Payroll cost trends
- Customer enquiries over time
Time series forecasting looks for patterns such as:
- Trend
- Seasonality
- Cycles
- Random variation
- Structural changes
- Outliers
- Turning points
For example, a retailer may see higher sales in November and December. A charity may see seasonal changes in demand. A manufacturer may see production cycles linked to customer orders.
Investopedia explains that time series forecasting uses past values and patterns to predict future trends, including trends, cycles and seasonality.
4. Driver-based forecasting
Driver-based forecasting links the forecast to the factors that actually drive performance.
For example:
Sales may be driven by:
- Number of leads
- Conversion rate
- Average order value
- Repeat purchase rate
- Customer retention
- Pricing
- Sales capacity
Cash flow may be driven by:
- Sales invoices raised
- Customer payment terms
- Debtor days
- Supplier payment terms
- Payroll timing
- VAT payments
- Loan repayments
- Capital expenditure
Service demand may be driven by:
- Population
- Referral rates
- Eligibility criteria
- Funding availability
- Seasonality
- Local need
- Policy change
Driver-based forecasting is often more useful than simply applying a percentage growth rate.
It shows what must happen for the forecast to be achieved.
5. Scenario-based forecasting
Scenario-based forecasting creates different possible forecasts based on different assumptions.
For example:
- Base case
- Best case
- Worst case
- Conservative case
- Stretch case
- Downside case
- Severe but plausible case
This is useful where uncertainty is high.
A business might prepare forecasts based on:
- Sales growing by 10%
- Sales staying flat
- Sales falling by 15%
- Costs rising faster than expected
- A major customer being lost
- Interest rates increasing
- A project being delayed
Scenario-based forecasting helps decision-makers ask:
What would we do if the future is not what we expect?
6. Rolling forecasting
A rolling forecast is updated regularly.
For example, instead of forecasting only to the end of the financial year, the organisation might always forecast the next 12 months.
Each month, the forecast rolls forward.
This is useful because conditions change.
A rolling forecast can help management respond to:
- Sales changes
- Cash flow pressure
- Cost increases
- Funding delays
- Project slippage
- Customer payment behaviour
- Staff changes
- Supplier changes
Rolling forecasts are especially useful for cash flow management, fast-growing businesses, charities with uncertain funding, and organisations with volatile demand.
Why forecasting matters
Forecasting matters because organisations make decisions before the future is known.
They need to decide:
- How much stock to buy
- How many staff to recruit
- Whether to invest
- Whether to borrow
- Whether to reduce costs
- Whether to launch a product
- Whether to accept a contract
- Whether cash will be sufficient
- Whether funding is secure
- Whether a project is viable
- Whether capacity is adequate
- Whether risk is increasing
- Whether the budget remains realistic
- Whether a strategy is affordable
- Whether a service can continue
Forecasting helps organisations reduce uncertainty.
It supports:
- Better planning
- Better budgeting
- Better cash control
- Better stock management
- Better workforce planning
- Better investment decisions
- Better risk management
- Better project control
- Better board reporting
- Better communication
- Better resource allocation
- Better strategic decisions
Forecasting does not make decisions easy. It makes them better informed.
When to use forecasting
Forecasting is useful whenever a future outcome needs to be estimated.
Common uses include:
- Annual budgeting
- Cash flow planning
- Sales planning
- Demand planning
- Workforce planning
- Stock control
- Project management
- Property appraisal
- Charity funding strategy
- Public sector service planning
- Manufacturing scheduling
- Technology capacity planning
- Marketing planning
- Customer support planning
- Capital expenditure decisions
- Business continuity planning
- Risk assessment
- Scenario planning
- Investment appraisal
- Board reporting
It is especially useful where decisions have financial, operational or strategic consequences.
It is less useful when treated as a one-off spreadsheet exercise that is not reviewed or challenged.
Forecasting in different industries
SMEs and owner-managed businesses
For SMEs, forecasting is often most valuable when it focuses on cash.
A small business may be profitable on paper but still run out of cash if customers pay late, stock absorbs working capital, costs rise, or tax payments arrive before receipts.
Typical SME forecasts include:
- Cash flow forecast
- Sales forecast
- Gross margin forecast
- Payroll forecast
- VAT and tax forecast
- Debtor forecast
- Stock forecast
- Profit forecast
- Loan repayment forecast
- Capacity forecast
An SME should use forecasting to answer:
- Will we have enough cash?
- What happens if customers pay late?
- Can we afford to recruit?
- Can we afford new equipment?
- What sales level do we need to break even?
- What happens if costs rise?
- Which customers or products drive profit?
- What needs action now?
For owner-managed businesses, the forecast should be practical, understandable and updated regularly.
Manufacturing
Manufacturing businesses rely on forecasts for demand, production, stock, labour, materials and cash.
Typical manufacturing forecasts include:
- Sales demand
- Production volume
- Material requirements
- Labour capacity
- Machine utilisation
- Stock levels
- Energy costs
- Supplier lead times
- Quality costs
- Cash flow
A manufacturer may use forecasting to decide:
- How much raw material to buy
- When to schedule production
- Whether overtime is needed
- Whether machinery capacity is sufficient
- Whether suppliers can meet demand
- Whether stock levels are too high or too low
- Whether cash is tied up in inventory
- Whether customer demand is changing
For manufacturing, forecasts should link sales, operations, procurement, finance and production planning.
A sales forecast that ignores production capacity is weak. A production forecast that ignores customer demand is equally weak.
Retail and ecommerce
Retail and ecommerce forecasting focuses heavily on demand, stock, customer behaviour and cash.
Typical forecasts include:
- Sales by product category
- Seasonal demand
- Stock requirements
- Returns
- Average order value
- Website conversion rate
- Customer acquisition cost
- Gross margin
- Cash flow
- Delivery volumes
Forecasting helps retailers avoid two common problems:
- Too much stock, which ties up cash and risks discounting.
- Too little stock, which loses sales and frustrates customers.
For ecommerce, forecasts should also consider advertising cost, conversion rates, fulfilment capacity, return rates and platform dependency.
A revenue forecast without a margin and returns forecast can be misleading.
Professional services
Professional services firms can forecast workload, fees, cash, staffing and capacity.
Typical forecasts include:
- Fee income
- Work in progress
- Billing
- Cash receipts
- Staff utilisation
- Project completion
- Client pipeline
- Recurring income
- Debtor days
- Recruitment needs
For accountants, solicitors, consultants, architects and advisers, forecasting helps answer:
- Are we pricing work properly?
- Do we have enough staff?
- Are deadlines achievable?
- Will cash receipts cover costs?
- Is work in progress turning into billing?
- Are we too dependent on one client or sector?
- Is advisory work growing?
- Are fixed-fee services profitable?
Professional services forecasts should connect sales pipeline, delivery capacity, billing and cash collection.
Charities and voluntary organisations
Charities use forecasting to manage income uncertainty, reserves, service demand and staffing.
Typical charity forecasts include:
- Grant income
- Donation income
- Fundraising income
- Contract income
- Payroll costs
- Project costs
- Reserves
- Cash flow
- Service demand
- Volunteer capacity
Charities often face a difficult forecasting problem: demand may rise at the same time as funding becomes uncertain.
A charity forecast should help trustees ask:
- How secure is income?
- Which grants are confirmed?
- Which income is assumed?
- How long will reserves last?
- What happens if a funder withdraws?
- Can we afford current staffing?
- Can we sustain services?
- What early action is needed?
For charities, forecasting should link closely to reserves policy, risk register, funding pipeline and service planning.
Public sector and local government
Public bodies use forecasting for budgets, demand, staffing, services and long-term planning.
Typical forecasts include:
- Service demand
- Population change
- Budget pressures
- Staffing requirements
- Inflation impact
- Procurement costs
- Housing need
- Social care demand
- Waste volumes
- Transport usage
Forecasting in the public sector must consider statutory duties, public value, equality, financial sustainability and political accountability.
For public bodies, forecasts should be transparent about assumptions, uncertainty and sensitivity.
Property and construction
Property and construction forecasting often involves long timeframes and significant uncertainty.
Typical forecasts include:
- Development costs
- Build programme
- Rental income
- Sales values
- Occupancy
- Finance costs
- Interest rates
- Maintenance costs
- Utility costs
- Cash flow
A property forecast might ask:
- What will the scheme cost?
- When will cash be spent?
- When will income start?
- What happens if planning is delayed?
- What happens if build costs rise?
- What happens if rent is lower than expected?
- What happens if interest rates change?
- Is the project still viable?
For property and construction, forecasting should be linked to sensitivity analysis, risk register, assumptions log and scenario planning.
Technology and software
Technology and software businesses forecast product growth, user behaviour, revenue, costs and capacity.
Typical forecasts include:
- Monthly recurring revenue
- Customer acquisition
- Churn
- Lifetime value
- Customer acquisition cost
- Hosting costs
- Support volumes
- Development resource
- Product usage
- Cash burn
Software forecasts should be driver-based.
For example:
New customers x average subscription x retention = forecast recurring revenue.
A forecast that assumes growth without modelling acquisition, churn and capacity can be misleading.
Healthcare and social care
Healthcare and social care forecasting must support safety, quality and capacity.
Typical forecasts include:
- Service demand
- Staffing needs
- Agency costs
- Care hours
- Referral volumes
- Bed occupancy
- Training requirements
- Funding income
- Equipment needs
- Waiting times
In healthcare and care, forecasting should not encourage unsafe shortcuts.
It should support safe staffing, continuity, safeguarding, regulatory compliance and service user outcomes.
Education and training
Education providers use forecasting for learner numbers, staffing, funding, course demand and outcomes.
Typical forecasts include:
- Enrolments
- Attendance
- Completion
- Funding income
- Tutor capacity
- Course demand
- Employer placements
- Learner support need
- Digital platform usage
- Progression outcomes
For education, forecasting should link to learner outcomes, funding rules, quality assurance, staffing and employer demand.
How to carry out forecasting properly
1. Define the purpose
Start by deciding why the forecast is needed.
Ask:
- What decision will the forecast support?
- What period does it cover?
- Who will use it?
- What level of detail is needed?
- What is the most important output?
- What assumptions matter most?
- What uncertainty exists?
- How often will it be updated?
- What action may follow?
- What would make the forecast useful?
A forecast without a clear purpose often becomes too detailed or too vague.
2. Define the forecast horizon
The forecast horizon is the period being forecast.
Examples include:
- 13-week cash flow forecast
- 12-month rolling forecast
- Quarterly sales forecast
- Three-year strategic forecast
- Five-year investment forecast
- Ten-year property forecast
Short-term forecasts are usually more accurate than long-term forecasts.
Longer forecasts are still useful, but they need more scenario testing and sensitivity analysis.
3. Gather good data
Forecast quality depends heavily on data quality.
Useful data may include:
- Historical sales
- Customer orders
- Enquiry levels
- Conversion rates
- Debtor days
- Supplier costs
- Payroll records
- Stock records
- Website analytics
- Service demand
- Grant pipeline
- Project programme
- Market data
- Economic data
- Competitor information
Poor data leads to poor forecasts.
Before using data, check:
- Is it complete?
- Is it accurate?
- Is it current?
- Is it consistent?
- Are there outliers?
- Has anything changed?
- Is the past still relevant?
- Are there missing periods?
- Are categories reliable?
- Is the data being interpreted properly?
4. Identify the key drivers
A good forecast should identify what drives the outcome.
Examples include:
- Sales volume
- Price
- Conversion rate
- Customer retention
- Payment timing
- Staff numbers
- Wage rates
- Stock turn
- Production capacity
- Referral rate
- Occupancy
- Energy usage
- Interest rates
- Inflation
- Project milestones
Driver-based forecasting is useful because it shows what assumptions really matter.
5. Choose the right method
Do not use a complicated method simply because it looks impressive.
Choose the method that fits the purpose, data and decision.
A simple forecast may be enough where:
- Data is limited
- The decision is small
- The time horizon is short
- The outcome is easy to understand
- The uncertainty is manageable
A more sophisticated forecast may be needed where:
- The decision is material
- Data is available
- Patterns are complex
- Seasonality matters
- The forecast affects investment
- Several variables interact
- Risk is high
The best method is the one that supports better decisions.
6. Record assumptions
Every forecast contains assumptions.
Examples include:
- Sales growth rate
- Customer payment timing
- Cost inflation
- Staff recruitment date
- Grant approval date
- Project start date
- Stock delivery date
- Interest rate
- Rent increase
- Conversion rate
These assumptions should be documented.
An assumptions log is useful because it records what the forecast relies on, why the assumption was made, what evidence supports it, and what happens if it is wrong.
7. Build scenarios
A single forecast can create false confidence.
Scenario forecasting helps test uncertainty.
At a minimum, consider:
- Base case
- Downside case
- Upside case
For important decisions, also consider:
- Severe but plausible downside
- Delayed income case
- Higher cost case
- Lower demand case
- Funding loss case
- Customer loss case
- Project delay case
Scenario forecasting helps management prepare actions before problems arrive.
8. Test sensitivities
Sensitivity analysis tests how much the forecast changes when one assumption changes.
For example:
- What if sales are 10% lower?
- What if wages rise by 6%?
- What if debtor days increase by 15 days?
- What if build costs rise by 8%?
- What if a grant is delayed by three months?
- What if interest rates rise by 1%?
- What if churn increases by 3%?
- What if stock lead times double?
Sensitivity analysis shows which assumptions matter most.
This is particularly useful for cash flow, investment appraisal, property development and charity funding.
9. Compare forecast with actual results
A forecast should be reviewed against actual performance.
This is essential.
Ask:
- What did we forecast?
- What actually happened?
- What was the variance?
- Why did the variance occur?
- Was the assumption wrong?
- Was the timing wrong?
- Was the data wrong?
- Was there bias?
- What should change next time?
- What action is needed now?
Forecasting improves through learning.
10. Update regularly
A forecast should be a living tool.
Update it when:
- Actual results arrive
- Orders change
- Costs change
- Funding changes
- Projects slip
- Risks increase
- Assumptions prove wrong
- External conditions change
- Management decisions change
- New evidence becomes available
A stale forecast can be worse than no forecast because it creates false confidence.
Forecast accuracy and forecast bias
Forecasts should be measured.
Two important concepts are accuracy and bias.
Forecast accuracy
Forecast accuracy measures how close the forecast was to the actual result.
Common accuracy measures include:
- Mean absolute error
- Mean absolute percentage error
- Weighted mean absolute percentage error
- Root mean squared error
- Forecast variance
- Actual versus forecast percentage
Accuracy matters because it helps improve future forecasting.
However, accuracy must be interpreted carefully.
A forecast may be inaccurate because of a one-off event, poor data, wrong assumptions, weak method or genuine uncertainty.
Forecast bias
Forecast bias shows whether forecasts are consistently too high or too low.
This is often more important than one-off accuracy.
A sales forecast that is always too optimistic creates stock, staffing and cash problems.
A cost forecast that is always too low creates budget pressure.
A cash forecast that always overstates receipts can create serious liquidity risk.
RELEX explains that forecast bias reveals systematic over-forecasting or under-forecasting and that tracking bias is important because systematic issues accumulate over time.
A good forecasting process should therefore ask:
- Are we consistently optimistic?
- Are we consistently cautious?
- Are some teams more biased than others?
- Are incentives affecting forecasts?
- Are forecasts being adjusted to please management?
- Are assumptions being challenged?
- Are actual results being used to improve the model?
Common forecasting methods
Moving average
A moving average uses the average of recent periods to forecast the next period.
For example, the next month’s sales might be forecast using the average of the last three months.
It is simple and useful where patterns are stable.
It is less useful where there is strong seasonality, rapid growth or sudden change.
Weighted moving average
A weighted moving average gives more weight to recent periods.
This can be useful where recent data is more relevant than older data.
For example, the last month might receive more weight than sales from six months ago.
Exponential smoothing
Exponential smoothing uses past data while giving more importance to recent observations.
It is widely used in demand forecasting and time series forecasting.
It can work well where there is a stable pattern, but it still depends on the quality and relevance of past data.
Regression analysis
Regression analysis examines relationships between variables.
For example:
- Sales and advertising spend
- Energy usage and production volume
- Staffing need and service demand
- Maintenance cost and property age
- Website enquiries and marketing spend
- Donations and campaign activity
Regression can help identify drivers, but it should be used carefully.
Correlation does not always mean causation.
Time series models
Time series models analyse data over time and may account for trend, seasonality and cycles.
They can be useful for demand, sales, stock, energy, service demand and financial forecasting.
More advanced methods include ARIMA and related models.
These methods can be useful, but they require suitable data and careful interpretation.
Delphi method
The Delphi method gathers expert views through structured rounds of questioning.
It is useful where hard data is limited and expert judgement matters.
It can be useful for policy, technology, innovation, long-term planning and uncertain markets.
Market research forecasting
Market research forecasting uses customer surveys, interviews, focus groups, competitor research and market data.
It is useful for new products, new services, pricing and market entry.
However, what people say and what they actually do can differ.
Research should be tested against behaviour where possible.
Pipeline forecasting
Pipeline forecasting estimates future sales or income based on current opportunities.
It may include:
- Lead value
- Probability of conversion
- Expected close date
- Sales stage
- Customer type
- Historic win rate
Pipeline forecasting is useful, but it can be highly biased if probabilities are not based on evidence.
Cash flow forecasting
Cash flow forecasting estimates cash receipts and payments over time.
It should include:
- Opening cash balance
- Customer receipts
- Supplier payments
- Payroll
- VAT and tax
- Rent
- Loan repayments
- Capital expenditure
- Grants
- Funding receipts
- Dividends or drawings
- Closing cash balance
Cash flow forecasting is one of the most important practical forecasts for SMEs and charities.
Profit does not pay bills. Cash does.
Common mistakes in forecasting
Mistake 1: Confusing forecast with target
A target is what the organisation wants.
A forecast is what the evidence suggests.
If the forecast is simply forced to match the target, it loses value.
Mistake 2: Using poor data
Bad data creates bad forecasts.
Data quality should be checked before forecasting.
Mistake 3: Ignoring seasonality
Many organisations have seasonal patterns.
Ignoring seasonality can lead to poor stock, staffing and cash decisions.
Mistake 4: Assuming the past will repeat
Historical data is useful, but the future may be different.
Market changes, regulation, technology, competition and customer behaviour can all break historic patterns.
Mistake 5: Not documenting assumptions
Undocumented assumptions are difficult to challenge.
They also make it hard to understand why the forecast changed.
Mistake 6: Overcomplicating the model
A complex model can look impressive but be difficult to understand.
If nobody can explain the forecast, people may not trust it or use it properly.
Mistake 7: Being too optimistic
Optimism is common in sales, fundraising, project planning and cost forecasts.
A good forecast should be realistic, not comforting.
Mistake 8: Ignoring cash timing
A profit forecast may look strong while cash flow is weak.
Timing matters.
Mistake 9: Not comparing forecast to actual
Forecasting improves through feedback.
If actual results are not compared with the forecast, mistakes are repeated.
Mistake 10: Not updating the forecast
An outdated forecast can mislead management.
Forecasts should be updated when evidence changes.
Limitations and weaknesses of forecasting
Forecasting is useful, but it has limits.
Forecasts are uncertain
No forecast is certain.
Unexpected events, customer behaviour, regulation, economic shocks and operational problems can all change outcomes.
Accuracy declines over time
Longer-term forecasts are usually less reliable than short-term forecasts.
This does not mean long-term forecasts are useless. It means they should be treated as planning tools, not promises.
Forecasts depend on assumptions
Every forecast relies on assumptions.
If assumptions are wrong, the forecast may be wrong.
Models can hide judgement
Even a spreadsheet or statistical model includes judgement.
Someone chooses the data, method, assumptions and adjustments.
Forecasts can create false confidence
A detailed forecast can look precise.
Precision is not the same as reliability.
A forecast showing £128,432 of cash in 18 months may look exact, but it may depend on uncertain assumptions.
Forecasts can be biased
Forecasts may be affected by incentives, politics, optimism, caution or pressure.
For example, a sales team may over-forecast to appear confident. A project team may under-forecast costs to secure approval.
Forecasts can be misused
Forecasts should support decisions.
They should not be used to justify decisions that have already been made.
Forecasts do not replace judgement
Forecasting supports management judgement.
It does not replace it.
Forecasting compared with other strategic and management tools
Forecasting and budgeting
Budgeting sets the approved plan.
Forecasting updates expectations.
Use the budget for control. Use forecasts for current decision-making.
Forecasting and scenario planning
Forecasting estimates likely outcomes.
Scenario planning explores different plausible futures.
Use forecasting for expected results. Use scenario planning where uncertainty is high.
Forecasting and assumptions log
Forecasts rely on assumptions.
An assumptions log records and tracks those assumptions.
Use both together.
Forecasting and risk register
Forecasting may reveal risks.
For example, a cash forecast may show a funding gap. A demand forecast may show capacity pressure.
Those risks should be added to the risk register.
Forecasting and risk appetite statement
A forecast may show whether risk exposure is within appetite.
For example, if forecast reserves fall below the agreed minimum, the organisation may be outside financial risk appetite.
Forecasting and business continuity plan
Forecasting can support continuity planning by estimating cash, staffing, demand, supplier needs and recovery resources.
Forecasting and horizon scanning
Horizon scanning identifies emerging signals.
Forecasting uses evidence and assumptions to estimate possible outcomes.
A horizon scan may reveal a trend that should be built into the forecast.
Forecasting and Balanced Scorecard
The Balanced Scorecard tracks performance across several perspectives.
Forecasting can show whether future performance is likely to meet scorecard targets.
Forecasting and OKRs
OKRs define objectives and measurable key results.
Forecasting can show whether current performance is likely to achieve those key results.
Forecasting and Business Model Canvas
The Business Model Canvas describes how an organisation creates, delivers and captures value.
Forecasting tests whether the model is financially and operationally realistic.
Alternatives and complementary frameworks
Scenario planning
Use scenario planning where the future could develop in several different ways.
Best used alongside forecasting for uncertain environments.
Sensitivity analysis
Use sensitivity analysis to test which assumptions have the biggest effect.
Best used for cash flow, investment appraisal, property development and financial planning.
Rolling forecast
Use rolling forecasts to keep projections current.
Best used where conditions change regularly.
Budget variance analysis
Use variance analysis to compare actual results with budget.
Best used for financial control.
Forecast variance analysis
Use forecast variance analysis to compare actual results with forecast.
Best used to improve forecasting accuracy.
Assumptions log
Use an assumptions log to record the assumptions behind the forecast.
Best used where assumptions are material or uncertain.
Driver-based model
Use driver-based forecasting to connect forecasts to the real factors behind performance.
Best used where activity levels, prices, conversion rates or capacity drive results.
Monte Carlo simulation
Use Monte Carlo simulation where many uncertain variables interact.
Best used for complex investment, project, financial or risk modelling.
Business impact analysis
Use business impact analysis to understand the effect of disruption.
Best used with business continuity planning.
A practical forecasting template
A useful forecasting template should include:
- Forecast name
- Purpose
- Owner
- Forecast period
- Date prepared
- Data sources
- Key drivers
- Key assumptions
- Forecast method
- Base case
- Downside case
- Upside case
- Sensitivity tests
- Actual results
- Variance
- Explanation of variance
- Risks identified
- Actions required
- Review date
- Version control
Example:
Forecast: 13-week cash flow forecast
Purpose: To ensure the business can meet payroll, supplier payments, VAT and loan repayments.
Key drivers: Customer receipts, debtor days, payroll, supplier payments, VAT, loan repayments and capital expenditure.
Key assumptions: Major customer pays £75,000 by 30 June, debtor days remain at 45, payroll remains stable, VAT payment due in week 8, no unplanned capital expenditure.
Downside case: Customer payment delayed by four weeks and sales receipts reduce by 10%.
Action trigger: Closing cash below £50,000 requires management review and payment prioritisation.
Owner: Finance Director.
Review frequency: Weekly.
Questions to ask when reviewing a forecast
Purpose questions
- What decision does this forecast support?
- Who will use it?
- What period does it cover?
- What level of detail is needed?
- What action might follow?
- Is this forecast for planning, control or warning?
- Is the forecast still relevant?
- Has the purpose changed?
- Is the audience clear?
- Does the forecast answer the right question?
Data questions
- What data has been used?
- Is the data accurate?
- Is the data complete?
- Is the data current?
- Are there outliers?
- Are categories consistent?
- Are there missing periods?
- Has the data been checked?
- Is the past still relevant?
- What data is missing?
Assumption questions
- What assumptions are being made?
- Why are those assumptions reasonable?
- What evidence supports them?
- What assumptions are most uncertain?
- What assumptions have the biggest impact?
- Are assumptions documented?
- Have assumptions been challenged?
- Are assumptions optimistic or cautious?
- Should any assumption be added to the assumptions log?
- What happens if the assumption is wrong?
Method questions
- What method has been used?
- Why is that method appropriate?
- Is the model too simple?
- Is the model too complex?
- Does it handle seasonality?
- Does it reflect key drivers?
- Does it include cash timing?
- Does it allow scenario testing?
- Can users understand it?
- Can it be updated easily?
Accuracy questions
- How accurate was the last forecast?
- What were the main variances?
- Were variances caused by timing?
- Were variances caused by assumptions?
- Were variances caused by unexpected events?
- Is there consistent bias?
- Are forecasts usually too optimistic?
- Are forecasts usually too cautious?
- What has been learned?
- What needs to change?
Risk questions
- What risks does the forecast reveal?
- Is cash pressure emerging?
- Are costs rising faster than expected?
- Is income uncertain?
- Are customer receipts delayed?
- Is capacity under pressure?
- Are assumptions outside risk appetite?
- Should risks be added to the risk register?
- Are contingency actions needed?
- What decision is required now?
The best way to think about forecasting
Forecasting is not fortune-telling.
It is disciplined planning under uncertainty.
A good forecast should be:
- Clear
- Evidence-based
- Assumption-aware
- Driver-based
- Regularly updated
- Compared with actual results
- Challenged
- Linked to action
- Supported by scenarios
- Useful for decisions
A weak forecast says:
“This is what will happen.”
A strong forecast asks:
“Based on what we know now, what is likely to happen, what could change, and what action should we take?”
The key question is not simply:
What is the forecast number?
The better question is:
What does the forecast tell us about decisions, risk, cash, capacity and timing?
Conclusion: forecasting turns uncertainty into better planning
Forecasting remains useful because organisations have to make decisions before outcomes are known.
No forecast will ever be perfect. That is not the point.
Used badly, forecasting becomes a spreadsheet exercise filled with optimistic assumptions and false precision.
Used properly, it becomes a practical management tool. It helps organisations understand likely outcomes, test assumptions, prepare for uncertainty, manage cash, allocate resources and make better decisions.
The real value is not in producing a forecast.
The real value is in using it.
A strong forecasting process helps an organisation move from saying, “We hope this will happen,” to asking, “What does the evidence suggest, what are we assuming, what could go wrong, and what should we do now?”