BCG Matrix:
A Practical Guide to Managing Products, Services and Business Portfolios
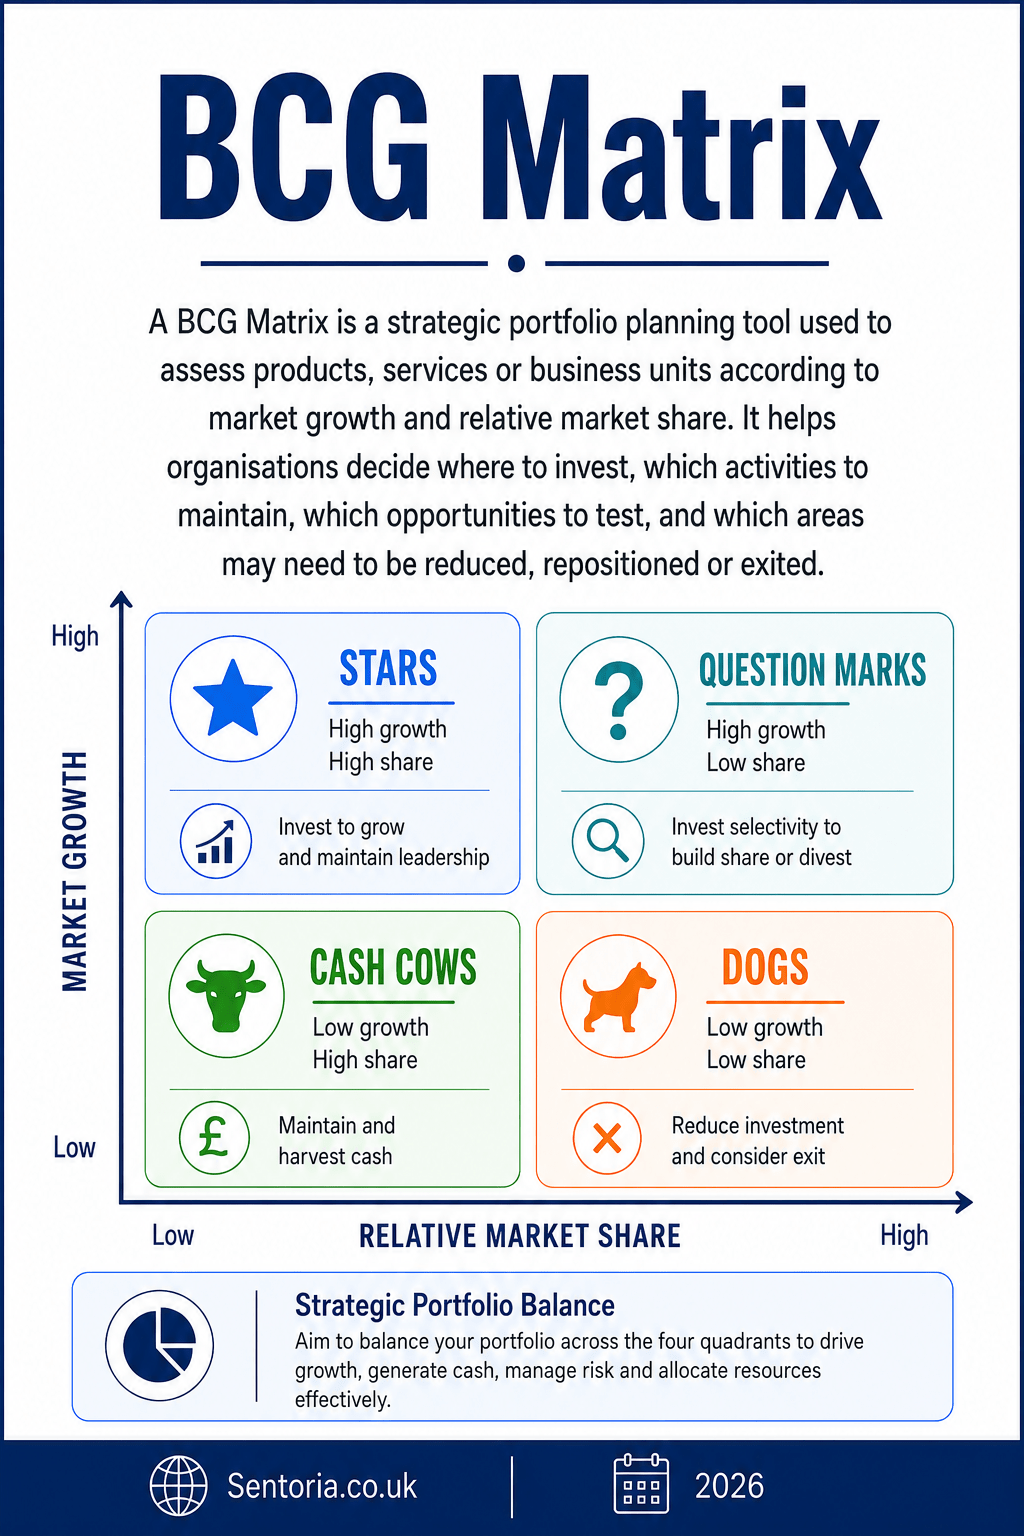
The BCG Matrix, also known as the Growth Share Matrix, is a strategic planning tool used to assess products, services, business units or activities based on two factors:
Market growth
Relative market share
At its simplest, the BCG Matrix asks:
Which parts of our portfolio should we invest in, which should we protect, which should we question, and which should we consider reducing, repositioning or exiting?
That makes it useful for portfolio management, product strategy, business planning, marketing, investment decisions, service reviews, charity programme reviews and strategic resource allocation.
The Boston Consulting Group describes the Growth Share Matrix as a portfolio management framework that helps companies decide how to prioritise different businesses. It divides the portfolio into four quadrants: Stars, Cash Cows, Question Marks and Dogs, based on market growth and relative market share.
Used properly, the BCG Matrix helps organisations think more clearly about where resources are being used, where future growth may come from, and where management attention may be tied up in activities with limited strategic return.
What is the BCG Matrix?
The BCG Matrix is a two-by-two framework.
One axis considers market growth. This is usually used as a proxy for market attractiveness. A high-growth market may offer opportunity, but may also require investment.
The other axis considers relative market share. This is usually used as a proxy for competitive strength. A business, product or service with high relative market share may have stronger competitive position, economies of scale, brand recognition, distribution strength or customer loyalty.
The four quadrants are:
- Stars: high market growth and high relative market share.
- Cash Cows: low market growth and high relative market share.
- Question Marks: high market growth and low relative market share.
- Dogs: low market growth and low relative market share.
The basic purpose is to help management decide how to allocate resources across a portfolio.
Some parts of the portfolio may need investment. Some may generate cash. Some may need careful testing. Some may need to be reduced, repositioned or exited.
History and development of the BCG Matrix
The BCG Matrix was developed by the Boston Consulting Group and is closely associated with Bruce Henderson, the founder of BCG. BCG states that the growth share matrix was put forward by Henderson in 1970 and remains a tool for managing strategic experimentation in uncertain conditions.
The matrix emerged during a period when large diversified corporations needed practical ways to manage portfolios of businesses. Management teams needed to decide which divisions or product lines deserved investment, which should fund growth elsewhere, and which might no longer justify the resources they consumed.
BCG later described the matrix as a framework for allocating resources based on the attractiveness of a market and the organisation’s own competitiveness within that market.
The model became widely used because it was simple, visual and practical. It reduced complex portfolio questions into a clear framework that management teams could discuss.
However, the simplicity of the model is also one of its limitations. Modern organisations often operate in markets where growth, profitability, competitive position and strategic value are more complex than the original two axes can show. BCG has argued that the matrix remains relevant, but needs to be used with important adjustments in a changing business environment.
The two axes of the BCG Matrix
1. Market growth
Market growth shows how quickly the market, sector, category or customer demand is expanding.
A high-growth market may indicate:
- Increasing demand
- Expanding customer base
- New technology adoption
- Changing customer behaviour
- Regulatory or social change creating opportunity
- Rising investment in the sector
- Early-stage market development
A low-growth market may indicate:
- Market maturity
- Limited customer expansion
- Stable demand
- Saturation
- Price competition
- Consolidation
- Declining relevance
Market growth matters because high-growth markets often require investment. Organisations may need to spend on marketing, product development, systems, capacity, people, stock, technology or customer acquisition.
However, growth alone is not enough. A growing market can still be unattractive if competition is intense, margins are weak, customers are costly to acquire, or the organisation lacks the capability to compete.
2. Relative market share
Relative market share compares the organisation’s position with competitors.
It is not simply the organisation’s absolute share of the market. It considers how strong the organisation is compared with the largest or most relevant competitor.
High relative market share may suggest:
- Strong brand position
- Customer loyalty
- Economies of scale
- Better distribution
- Stronger reputation
- Lower unit costs
- Better bargaining power
- Greater experience
Low relative market share may suggest:
- Weak competitive position
- Limited customer awareness
- Higher unit costs
- Poor distribution
- Weak differentiation
- Low scale
- Vulnerability to competitors
- Need for investment
Relative market share matters because a business that is strong in its market may be better placed to generate profit and cash than a small player struggling for visibility.
However, market share is not always the same as profitability. A niche business with low market share may still be very profitable if it serves a specialist segment well.
The four quadrants of the BCG Matrix
1. Stars
Stars are products, services or business units with high market growth and high relative market share.
They are strong positions in attractive, growing markets.
Stars may require significant investment because the market is growing and competitors are likely to be active. The organisation may need to invest in capacity, marketing, product development, technology, staff and customer support to maintain or improve its position.
Examples of Star characteristics include:
- Strong demand growth
- High customer interest
- Competitive strength
- Strong brand or market position
- Potential for future cash generation
- Need for continued investment
- Strategic importance
The aim with Stars is usually to invest, protect and grow.
A successful Star may eventually become a Cash Cow when market growth slows, provided it retains a strong market position.
2. Cash Cows
Cash Cows are products, services or business units with low market growth and high relative market share.
They operate in more mature markets but hold a strong competitive position.
Cash Cows are important because they can generate cash that supports the wider organisation. They may not need the same level of growth investment as Stars, but they still need maintenance, quality control, customer retention and careful management.
Examples of Cash Cow characteristics include:
- Strong market position
- Stable demand
- Predictable income
- Lower investment needs
- Strong cash generation
- Established customer base
- Operational efficiency
The aim with Cash Cows is usually to protect, optimise and use cash wisely.
However, Cash Cows should not be neglected. If quality falls, customer loyalty weakens, technology changes or new substitutes appear, a Cash Cow can decline faster than expected.
3. Question Marks
Question Marks are products, services or business units with high market growth but low relative market share.
They operate in attractive markets but do not yet have a strong position.
This is often the most difficult quadrant because management must decide whether to invest or withdraw.
A Question Mark may become a Star if investment works and market share improves. It may become a Dog if the organisation fails to gain traction.
Examples of Question Mark characteristics include:
- High-growth market
- Low market share
- Uncertain future
- High investment requirement
- Weak or developing brand position
- Need for evidence and testing
- Strategic decision required
The aim with Question Marks is usually to evaluate carefully.
Management should ask whether the organisation has a realistic route to gaining share. If the answer is yes, investment may be justified. If not, continued spending may simply drain resources.
4. Dogs
Dogs are products, services or business units with low market growth and low relative market share.
They sit in unattractive or mature markets where the organisation also lacks strong position.
Dogs may absorb management time, staff effort, working capital and operational complexity without contributing enough value.
Examples of Dog characteristics include:
- Low demand growth
- Weak competitive position
- Low profitability
- Limited strategic value
- Management distraction
- Poor future prospects
- Potential exit candidate
The traditional recommendation is often to divest, close, reduce or harvest these activities. However, this should not be automatic.
Some Dogs may still have strategic value. They may support a wider customer relationship, complete a product range, use spare capacity, support brand positioning, or provide a route into other services.
The key question is whether the activity genuinely contributes to the wider strategy, or whether it simply continues because nobody has challenged it.
Why the BCG Matrix matters
The BCG Matrix matters because resources are limited.
Most organisations cannot invest heavily in everything. They need to make choices.
A business may have too many product lines. A charity may have too many programmes. A professional firm may offer too many services. A local authority may have too many initiatives competing for capacity. A manufacturer may have too many low-margin product variants. A retailer may carry stock that ties up cash without generating enough return.
The BCG Matrix helps create a structured conversation about resource allocation.
It supports:
- Portfolio review
- Investment decisions
- Product strategy
- Service review
- Cash allocation
- Marketing focus
- Growth planning
- Exit decisions
- Management attention
- Strategic prioritisation
It also helps challenge emotional attachment.
Some products or services continue because they are familiar, historic or personally liked. The BCG Matrix asks whether they still deserve resources in light of market attractiveness and competitive position.
When to use the BCG Matrix
The BCG Matrix is useful when an organisation has a portfolio of products, services, business units, programmes, markets or activities.
Good uses include:
- Product portfolio review
- Business unit review
- Marketing strategy
- Investment prioritisation
- Strategic planning
- Service rationalisation
- Charity programme review
- Retail range review
- Manufacturing product line review
- Professional services review
- Technology product roadmap review
- Budget allocation
- Growth planning
- Exit or divestment decisions
- Board strategy sessions
It is especially useful when the organisation needs to decide where to invest, where to maintain, where to test, and where to reduce.
It is less useful where the organisation has only one product or service, or where market share and market growth are difficult to define meaningfully.
BCG Matrix in different industries
SMEs and owner-managed businesses
For SMEs, the BCG Matrix can be very useful because small businesses often carry too many activities.
An owner-managed business may have:
- Core services that generate reliable cash
- New services that could grow
- Legacy services that take time but add little value
- Small experiments that may or may not be worth investment
- Customers or sectors with very different growth prospects
A small business could use the matrix to ask:
- Which services generate cash?
- Which services have growth potential?
- Which services are we supporting out of habit?
- Which activities need investment?
- Which activities should be stopped?
- Which customers or sectors deserve more focus?
- Are we spreading ourselves too thinly?
For SMEs, the matrix should be used pragmatically. The aim is not academic precision. The aim is better focus.
Manufacturing
Manufacturers often have multiple product lines, customers, sectors and technical capabilities.
The BCG Matrix can help review:
- High-volume established products
- Low-volume specialist products
- New product developments
- Declining product lines
- Product variants
- Export markets
- Customer sectors
- Spare parts or aftercare services
For manufacturing, the matrix should be linked to contribution margin, machine utilisation, stock holding, production complexity, customer demand, supplier risk and technical capability.
A product may look like a Dog based on market growth and share, but still support a profitable aftersales relationship or use spare capacity effectively. That is why judgement is required.
Retail and ecommerce
Retailers and ecommerce businesses can use the BCG Matrix to review product categories, brands, ranges, channels and customer segments.
A retailer might identify:
- Fast-growing categories with strong market position as Stars
- Established bestsellers as Cash Cows
- New product ranges as Question Marks
- Slow-moving stock as Dogs
For ecommerce, the matrix should be combined with data such as:
- Gross margin
- Stock turn
- Customer acquisition cost
- Repeat purchase rate
- Return rates
- Search demand
- Conversion rate
- Fulfilment cost
A product with high revenue but poor margin may not be as attractive as it appears. A product with modest sales may be strategically useful if it attracts new customers or supports repeat purchase.
Professional services
For accountants, solicitors, consultants, architects and advisers, the BCG Matrix can be applied to service lines, client types or sectors.
A firm might review:
- Compliance work
- Advisory work
- Retainer services
- One-off project work
- Specialist sector services
- Training services
- Low-fee legacy work
- New digital services
For example, a monthly advisory service in a growing market with strong client demand may be a Star. Established compliance work may be a Cash Cow. A new consultancy offer may be a Question Mark. Low-fee, high-admin work may be a Dog.
For professional services, the matrix should be linked to staff capacity, margin, client quality, recurring income, risk and strategic positioning.
Charities and voluntary organisations
Charities can adapt the BCG Matrix carefully, although the language of market share and cash generation may need adjusting.
Instead of products, a charity might analyse programmes, services, funding streams or beneficiary groups.
A charity might ask:
- Which services have growing demand and strong delivery capability?
- Which programmes are well established and reliably funded?
- Which new services need testing?
- Which activities consume resources but create limited impact?
- Which programmes support the charity’s mission even if they do not generate income?
- Which services are strategically important because no one else provides them?
For charities, the matrix should not be used crudely. A low-income service may still be essential if it creates high social impact. The BCG Matrix should be combined with impact assessment, safeguarding, funding strategy, reserves policy and trustee judgement.
Public sector and local government
In the public sector, the BCG Matrix can be adapted for service portfolio review, although financial language needs careful handling.
A council or public body might use it to consider:
- Services with growing demand and strong delivery capability
- Established services that are stable and efficient
- New preventative services with uncertain outcomes
- Low-impact discretionary activities
- Programmes that need redesign
- Services where demand is falling
- Activities that no longer fit strategic priorities
The purpose should not simply be to cut low-growth services. Public bodies have statutory duties and public value responsibilities.
For public sector use, the matrix should sit alongside statutory obligations, equality impact assessment, public consultation, demand analysis and value-for-money review.
Property and construction
Property and construction businesses can use the BCG Matrix to review sites, asset classes, tenant types, project opportunities or service lines.
A property business might classify:
- High-demand, strong-position assets as Stars
- Mature, income-producing assets as Cash Cows
- Development opportunities as Question Marks
- Underperforming assets in weak locations as Dogs
A construction business might use the matrix to review sectors such as residential, commercial, heritage, public sector, maintenance, specialist works or framework contracts.
For property and construction, the matrix should be supported by valuation, planning analysis, finance costs, build costs, tenant demand, yield, risk and cash flow.
Technology and software
Technology businesses can use the BCG Matrix to review product modules, customer segments, markets, platforms or features.
Possible examples include:
- A fast-growing product with strong adoption as a Star
- A mature subscription product with low churn as a Cash Cow
- A new AI feature in a growing market as a Question Mark
- A legacy module with low usage and high maintenance as a Dog
For software businesses, the matrix should be combined with:
- Monthly recurring revenue
- Churn
- Customer acquisition cost
- Lifetime value
- Product usage
- Support burden
- Technical debt
- Development cost
- Roadmap fit
A product or feature may have low direct revenue but high strategic importance if it supports retention or platform adoption.
Healthcare and social care
Healthcare and social care organisations can adapt the BCG Matrix carefully for service review.
A provider might consider:
- Services with growing demand and strong delivery capability
- Established services with reliable funding
- New models of care that need testing
- Services with low demand, weak funding or high delivery risk
- Specialist services with high social value
- Preventative services that reduce future demand
The matrix must not be used as a crude commercial tool in safety-critical or care settings.
It should be combined with quality, safeguarding, clinical governance, workforce planning, regulatory compliance and patient or service user outcomes.
Education and training
Education and training providers can use the BCG Matrix to review courses, qualifications, learner segments, delivery methods and employer partnerships.
A provider might identify:
- Courses in growing skills areas with strong enrolment as Stars
- Established courses with reliable demand as Cash Cows
- New digital courses as Question Marks
- Low-enrolment courses with weak outcomes as Dogs
For education, the matrix should be linked to learner outcomes, funding rules, employer demand, staff capacity, quality assurance and progression routes.
A course may be financially weak but strategically important if it supports inclusion, community need or wider curriculum pathways.
How to carry out a BCG Matrix analysis properly
1. Define the portfolio
Start by deciding what you are analysing.
This could be:
- Products
- Services
- Business units
- Customer segments
- Markets
- Programmes
- Departments
- Locations
- Channels
- Projects
Be consistent. Do not mix products, customer segments and departments in the same matrix unless the purpose is clear.
2. Define the market
The matrix depends heavily on how the market is defined.
For example, a business may have low share in the national market but high share in a local niche.
Ask:
- What market are we measuring?
- Is it local, regional, national or international?
- Is it a broad market or a specialist niche?
- Who are the relevant competitors?
- Are substitutes included?
- Is the market definition meaningful to customers?
Poor market definition leads to poor analysis.
3. Measure market growth
Estimate market growth using reliable data where possible.
Sources may include:
- Sales trends
- Market research
- Industry reports
- Customer demand
- Search data
- Funding trends
- Demographic data
- Competitor growth
- Internal enquiry levels
- Regulatory or policy trends
Where precise data is not available, use a reasoned judgement and record the assumption.
4. Measure relative market share
Estimate the organisation’s relative share compared with competitors.
Possible measures include:
- Revenue share
- Unit sales
- Customer numbers
- Enquiries
- Local visibility
- Search ranking
- Market coverage
- Contract share
- Occupancy
- Usage
Again, precision is useful, but judgement may be required.
5. Plot each item on the matrix
Place each product, service or business unit into one of the four quadrants.
Ask:
- Is the market growing quickly or slowly?
- Is our relative position strong or weak?
- Is this a Star, Cash Cow, Question Mark or Dog?
- Are there borderline cases?
- Do we need more evidence?
Do not force false precision. The discussion is often more valuable than the exact position.
6. Add financial and operational data
The traditional BCG Matrix uses growth and share, but modern use should include additional information.
Add:
- Revenue
- Profit
- Gross margin
- Cash generation
- Investment required
- Staff capacity
- Risk
- Customer satisfaction
- Strategic fit
- Operational complexity
This prevents the matrix from becoming too simplistic.
7. Decide the strategic response
Each quadrant suggests a possible response.
Stars: invest, grow, protect and strengthen.
Cash Cows: maintain, optimise and use cash wisely.
Question Marks: test, invest selectively or exit.
Dogs: reduce, reposition, harvest, exit or retain only if strategically justified.
These are not automatic rules. They are starting points for discussion.
8. Test the assumptions
Before making major decisions, test the assumptions.
Ask:
- Is the market really growing?
- Is our share really weak or strong?
- Are margins attractive?
- Is investment affordable?
- Are competitors changing?
- Are customers changing?
- Does the activity support wider strategy?
- What happens if we exit?
- What happens if we invest?
- What risks are involved?
9. Convert the analysis into action
The output should lead to practical decisions.
Actions may include:
- Increase investment
- Reduce investment
- Reposition a product
- Improve marketing
- Change pricing
- Simplify the range
- Exit a service
- Sell a business unit
- Develop a growth plan
- Improve profitability
- Reallocate staff
- Review costs
- Test a new market
- Strengthen a Cash Cow
- Monitor a Question Mark
Without action, the matrix is only a diagram.
10. Review regularly
Portfolio positions change.
A Star can become a Cash Cow. A Question Mark can become a Star or Dog. A Cash Cow can decline. A Dog can sometimes be repositioned.
Review the matrix when:
- Market conditions change
- Competitors move
- New products launch
- Costs rise
- Customer demand shifts
- Technology changes
- Regulation changes
- Funding changes
- Profitability changes
- Strategy is reviewed
Common mistakes in using the BCG Matrix
Mistake 1: Treating the quadrants as automatic decisions
The matrix gives guidance, not instructions.
Not every Dog should be closed. Not every Star should receive unlimited investment. Not every Cash Cow should be milked aggressively. Not every Question Mark deserves funding.
Judgement is essential.
Mistake 2: Defining the market too broadly
Market definition can completely change the result.
A product may be weak in a broad market but strong in a niche.
The chosen market must reflect real customer choice and competitive alternatives.
Mistake 3: Ignoring profitability
High market share does not always mean high profit.
A product may have strong share but weak margins. Another may have low share but high profitability in a specialist niche.
Profitability and cash flow should be included.
Mistake 4: Ignoring strategic fit
Some activities are strategically important even if they do not look attractive in the matrix.
For example, a low-growth service may support customer retention, brand credibility or regulatory requirements.
Mistake 5: Over-investing in Question Marks
Question Marks can be tempting because they sit in growing markets.
However, investment only makes sense if there is a realistic route to stronger market share.
Mistake 6: Neglecting Cash Cows
Cash Cows generate value, but they still need care.
If quality, customer service, systems or brand are neglected, cash generation may decline.
Mistake 7: Keeping Dogs for emotional reasons
Some low-growth, low-share activities continue because they are historic or familiar.
The matrix helps challenge whether they still deserve resources.
Mistake 8: Ignoring competitors
Relative market share depends on competitor position.
A BCG Matrix without competitor analysis is weak.
Mistake 9: Using poor data
The matrix is only as good as the evidence behind it.
Market growth, market share, margin and investment requirements should be based on the best available data.
Mistake 10: Not linking the matrix to action
The matrix should influence strategy, budgets, people, marketing and operational decisions.
If nothing changes, the exercise has limited value.
Limitations and weaknesses of the BCG Matrix
The BCG Matrix is useful, but it has limits.
It is too simple for some decisions
The model uses only two main dimensions: market growth and relative market share.
Real strategy may depend on many more factors, including profitability, cash flow, risk, customer value, strategic fit, regulation, capability and timing.
Market growth does not always mean attractiveness
A high-growth market can be expensive, risky and unprofitable.
Growth may attract competitors, require heavy investment and create pressure on cash.
Market share does not always mean advantage
High market share can be useful, but it is not always the main source of advantage.
Some organisations compete successfully through niche focus, premium service, intellectual property, brand, relationships or specialist expertise.
It can undervalue niches
A low-share position in a broad market may actually be a strong position in a profitable niche.
This is particularly relevant for SMEs, professional services, specialist manufacturing, charities and local businesses.
It can encourage short-term thinking
If used badly, the matrix can lead to cutting activities too quickly or over-investing in growth without proper testing.
It may ignore synergies
A product or service may support another part of the portfolio.
For example, a low-profit service may help win larger customers, complete an offer, use spare capacity or strengthen relationships.
It can be difficult to apply to charities and public bodies
Market share and market growth may not translate neatly into social value, statutory duty, public need or mission impact.
The framework needs careful adaptation.
It can become static
Markets change. Competitors respond. Technology shifts. Customer preferences move.
A BCG Matrix should be reviewed regularly.
BCG Matrix compared with other strategic tools
BCG Matrix and SWOT
SWOT identifies strengths, weaknesses, opportunities and threats.
The BCG Matrix helps assess the position of products, services or business units within a portfolio.
Use SWOT to understand strategic position. Use the BCG Matrix to prioritise portfolio decisions.
BCG Matrix and PESTLE
PESTLE examines political, economic, social, technological, legal and environmental factors.
PESTLE can help assess whether market growth is likely to continue.
Use PESTLE to understand external drivers. Use the BCG Matrix to assess portfolio implications.
BCG Matrix and Porter’s Five Forces
Porter’s Five Forces examines industry structure and competitive pressure.
The BCG Matrix examines portfolio position using growth and share.
Use Five Forces to test whether a high-growth market is genuinely attractive. Use the BCG Matrix to decide where portfolio resources may go.
BCG Matrix and TOWS
TOWS turns SWOT findings into strategic options.
The BCG Matrix can inform TOWS by identifying which products or services need investment, protection, testing or exit.
BCG Matrix and Business Model Canvas
The Business Model Canvas explains how an organisation creates, delivers and captures value.
The BCG Matrix helps assess which parts of a portfolio deserve resources.
Use the Canvas to understand the business model. Use the BCG Matrix to review portfolio balance.
BCG Matrix and Value Chain Analysis
Value chain analysis examines activities that create value and incur cost.
The BCG Matrix may identify which products or services need review. Value chain analysis can then explain why they are profitable or costly.
BCG Matrix and Balanced Scorecard
The Balanced Scorecard translates strategy into objectives, measures, targets and actions.
Use the BCG Matrix to inform strategic priorities. Use the Balanced Scorecard to track delivery.
BCG Matrix and Risk Register
Portfolio decisions create risks.
For example, over-reliance on one Cash Cow, over-investment in Question Marks, or slow exit from Dogs may need to be recorded in the risk register.
BCG Matrix and Scenario Planning
Scenario planning tests how different futures may affect the portfolio.
A Cash Cow may become vulnerable in one scenario. A Question Mark may become more attractive in another.
Alternatives and complementary frameworks
GE-McKinsey Matrix
The GE-McKinsey Matrix is a more detailed portfolio tool that considers industry attractiveness and business unit strength across multiple factors.
Use it when the BCG Matrix is too simple.
Ansoff Matrix
The Ansoff Matrix considers growth options through market penetration, market development, product development and diversification.
Use it when deciding how to grow.
Product Life Cycle
The product life cycle examines introduction, growth, maturity and decline.
Use it when product age and maturity are important.
Porter’s Five Forces
Use it to understand competitive pressure and market attractiveness.
This is useful before investing in Stars or Question Marks.
Value Chain Analysis
Use it to understand why a product or service is profitable, costly, slow or strategically important.
Contribution analysis
Use contribution analysis to understand revenue, variable costs and contribution margin.
This is essential before making investment or exit decisions.
Customer profitability analysis
Use it to understand which customers or segments create profit.
This can complement the BCG Matrix where customer groups are being reviewed.
Risk Register
Use it to record risks arising from portfolio decisions.
This is particularly important where the organisation relies heavily on a small number of Cash Cows.
A practical BCG Matrix template
A useful BCG Matrix template should include more than the four quadrants.
For each product, service or business unit, record:
- Name
- Description
- Market definition
- Market growth
- Relative market share
- Revenue
- Gross margin
- Profit or contribution
- Cash generation
- Investment required
- Operational complexity
- Strategic fit
- Customer importance
- Risk
- Quadrant
- Recommended action
- Owner
- Deadline
- Review date
Example:
Product or service: Monthly advisory package
Market growth: High
Relative market share: Low
Quadrant: Question Mark
Revenue: Growing but early stage
Margin: Potentially strong if delivery is systemised
Strategic fit: High
Investment required: Marketing, templates, reporting tools and staff training
Recommended action: Invest selectively and test demand with existing clients
Owner: Managing Director
Review date: Quarterly
Questions to ask during BCG Matrix analysis
Portfolio questions
- What products, services or business units are being reviewed?
- Are they defined consistently?
- Which generate the most income?
- Which generate the most profit?
- Which consume the most resources?
- Which are strategically important?
- Which are declining?
- Which are growing?
- Which are experimental?
- Which should be challenged?
Market growth questions
- Is the market growing?
- How quickly is it growing?
- What evidence supports this?
- Is growth temporary or structural?
- What is driving growth?
- Could growth slow?
- Is the market profitable?
- Is growth attracting competitors?
- Does the organisation have the capability to grow?
- What investment is required?
Market share questions
- What is our relative market share?
- Who are the main competitors?
- Are we stronger or weaker than them?
- Is our position improving?
- Is our position defensible?
- What drives our market share?
- Are customers loyal?
- Are substitutes relevant?
- Are we strong in a niche?
- What would it take to gain share?
Financial questions
- What revenue does this generate?
- What gross margin does it produce?
- What cash does it generate or consume?
- What investment is required?
- What working capital is tied up?
- What staff capacity does it use?
- What overhead does it absorb?
- What happens if it is reduced?
- What happens if it grows?
- Is it financially sustainable?
Strategic questions
- Does this fit our strategy?
- Does it support our brand?
- Does it support customer relationships?
- Does it create future opportunity?
- Does it distract management?
- Is it mission-critical?
- Is it replaceable?
- Should we invest, maintain, test, reduce or exit?
- What risks are involved?
- What decision is needed?
The best way to think about the BCG Matrix
The BCG Matrix is not a perfect model.
It is a practical conversation tool.
A good BCG Matrix analysis should be:
- Evidence-based
- Clear about market definition
- Supported by financial data
- Honest about competitive position
- Linked to strategy
- Aware of limitations
- Focused on action
- Reviewed regularly
A weak BCG Matrix says:
“This is a Star, this is a Cash Cow, this is a Dog.”
A strong BCG Matrix asks:
“What does this tell us about investment, cash, growth, risk and strategic focus?”
Conclusion: the BCG Matrix turns portfolio complexity into strategic choice
The BCG Matrix remains useful because organisations need to make choices.
Not every product, service, project or business unit deserves the same level of investment, attention or protection. Some activities are engines of future growth. Some generate cash. Some need testing. Some drain resources.
Used badly, the BCG Matrix becomes a simplistic labelling exercise.
Used properly, it becomes a practical tool for resource allocation. It helps leaders, managers, trustees and boards ask difficult but necessary questions about where value is being created, where investment should go, where cash is generated, and where activity may need to change.
The real value is not in placing items into four boxes.
The real value is in the decisions that follow.
A strong BCG Matrix analysis helps an organisation focus resources where they can make the greatest difference, protect what funds the future, challenge weak activities, and build a more balanced portfolio.